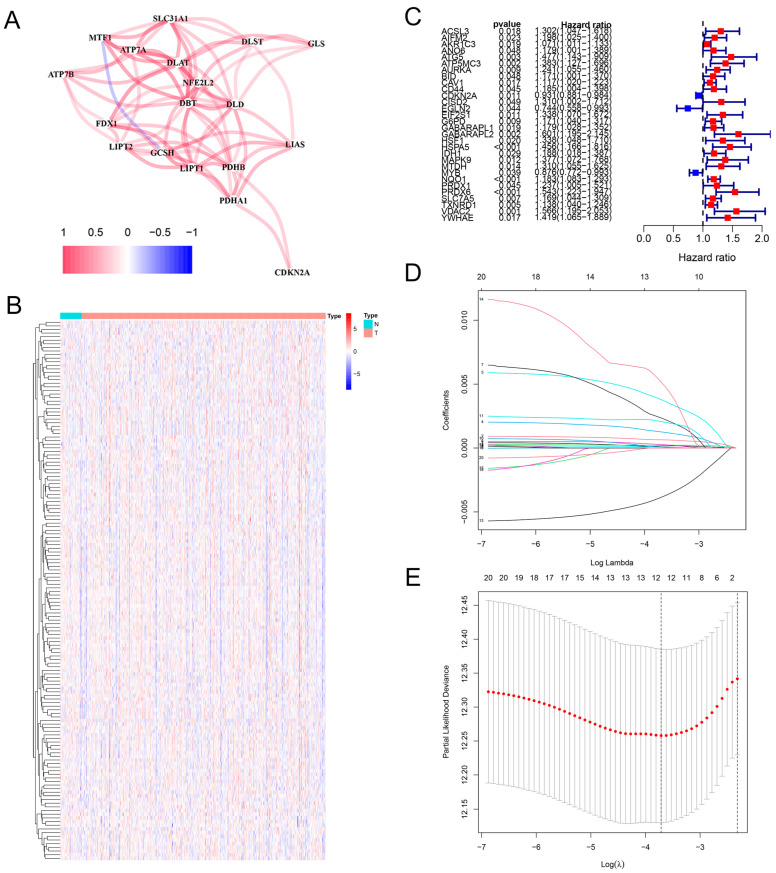
Figure 1.
Construction of the risk model based on cuproptosis-associated ferroptosis genes in HNSCC. (A) Correlation networks explain the interactions between cuproptosis genes in HNSCC: red represents positive correlations; blue represents negative correlations. (B) Clustered heatmap of the expression of 150 cuproptosis-associated ferroptosis genes in HNSCC. (C) One-way regression analysis of cuproptosis-associated ferroptosis genes in HNSCC. (D,E) LASSO regression analysis with cuproptosis-associated ferroptosis genes in HNSCC. Coefficient profiles were drawn based on (log λ) sequences and the value of lambda. Min was defined based on 10-fold cross-validation, where the optimal λ yielded 12 cuproptosis-associated ferroptosis genes.

