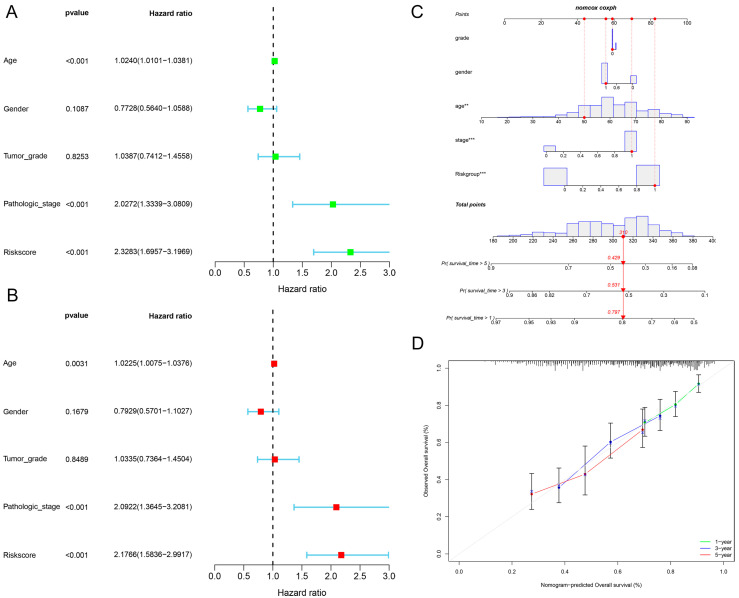
Figure 4.
Validation of the predictive performance of our risk prognostic model constructed on the basis of 12 cuproptosis-associated ferroptosis genes in HNSCC. (A) One-way regression analyses were performed to validate the predictive performance of the risk prognostic model we constructed. (B) Multifactorial regression analyses were performed to validate the predictive performance of the risk prognostic model we constructed. (C) The prognostic nomogram graph for a given patient was assessed using the risk prognostic model we constructed (** p-value < 0.01, *** p-value < 0.001). The red numbers in the column line graph represent the overall score and predicted 1-year survival, 3-year survival, and 5-year survival for a given patient, respectively. (D) The calibration plot for a given patient was assessed using the risk prognostic model we constructed.

