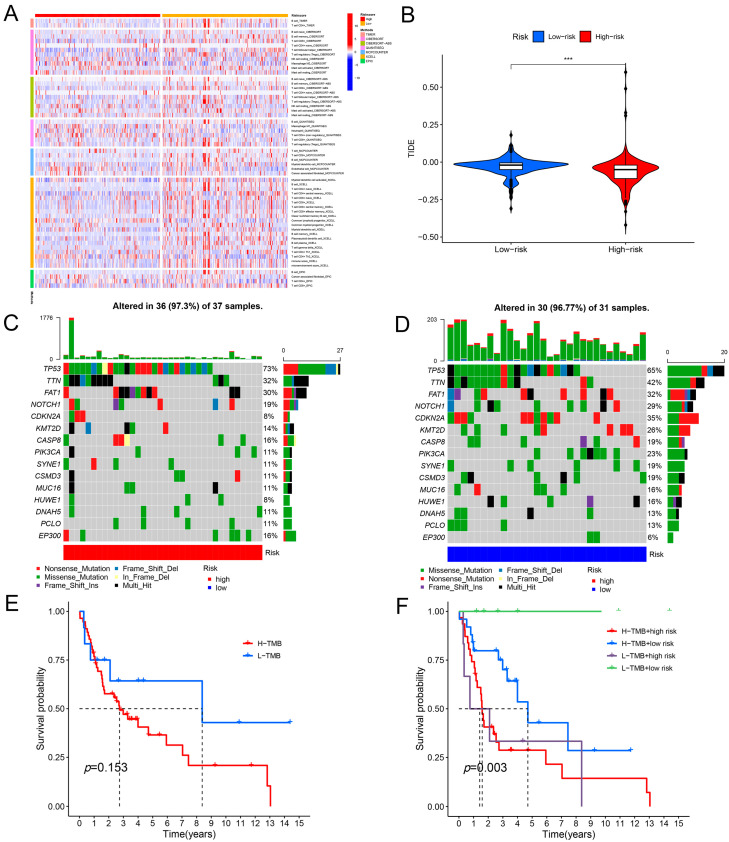
Figure 7.
The correlation between the risk model and immunological characteristics. (A) Immune infiltration characteristics of the population in the high- and low-risk groups were calculated based on seven algorithms. (B) TIDE scores of people in the high- and low-risk groups. (C) Characteristics of the first 15 TMB mutations in the population of the high-risk group. (D) Characteristics of the first 15 TMB mutations in the population of the low-risk group. (E) Results of KM survival analyses for populations with different TMB scores. (F) Results of KM survival analysis for different scores in different subgroup populations. *** p-value < 0.001.

