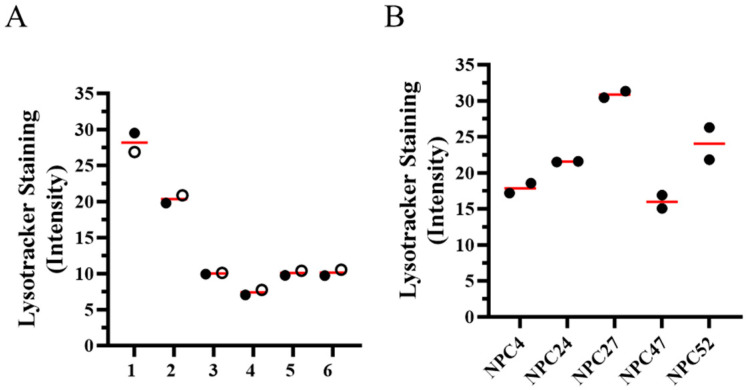
Figure 4.
Lysotracker staining intensity in fibroblasts from sibling pairs and NPC1I1061T/I1061T individuals. Lysotracker data was previously published [53] but repurposed for this analysis. (A) Lysotracker staining intensity in six sibling pairs. The mean value of two measurements is indicated for each sibling as either an open or filled circle. Sibling pairs 1, 5 and 6 correspond to sibling pairs 1, 5 and 6 in Figure 2. Sibling pair 3 corresponds to sibling pair 2 in Figure 3. (B) Lysotracker staining intensity in five individuals homozygous for the p.I1061T variant. Two measurements from each individual, with mean value indicated by the red bar, are included.

