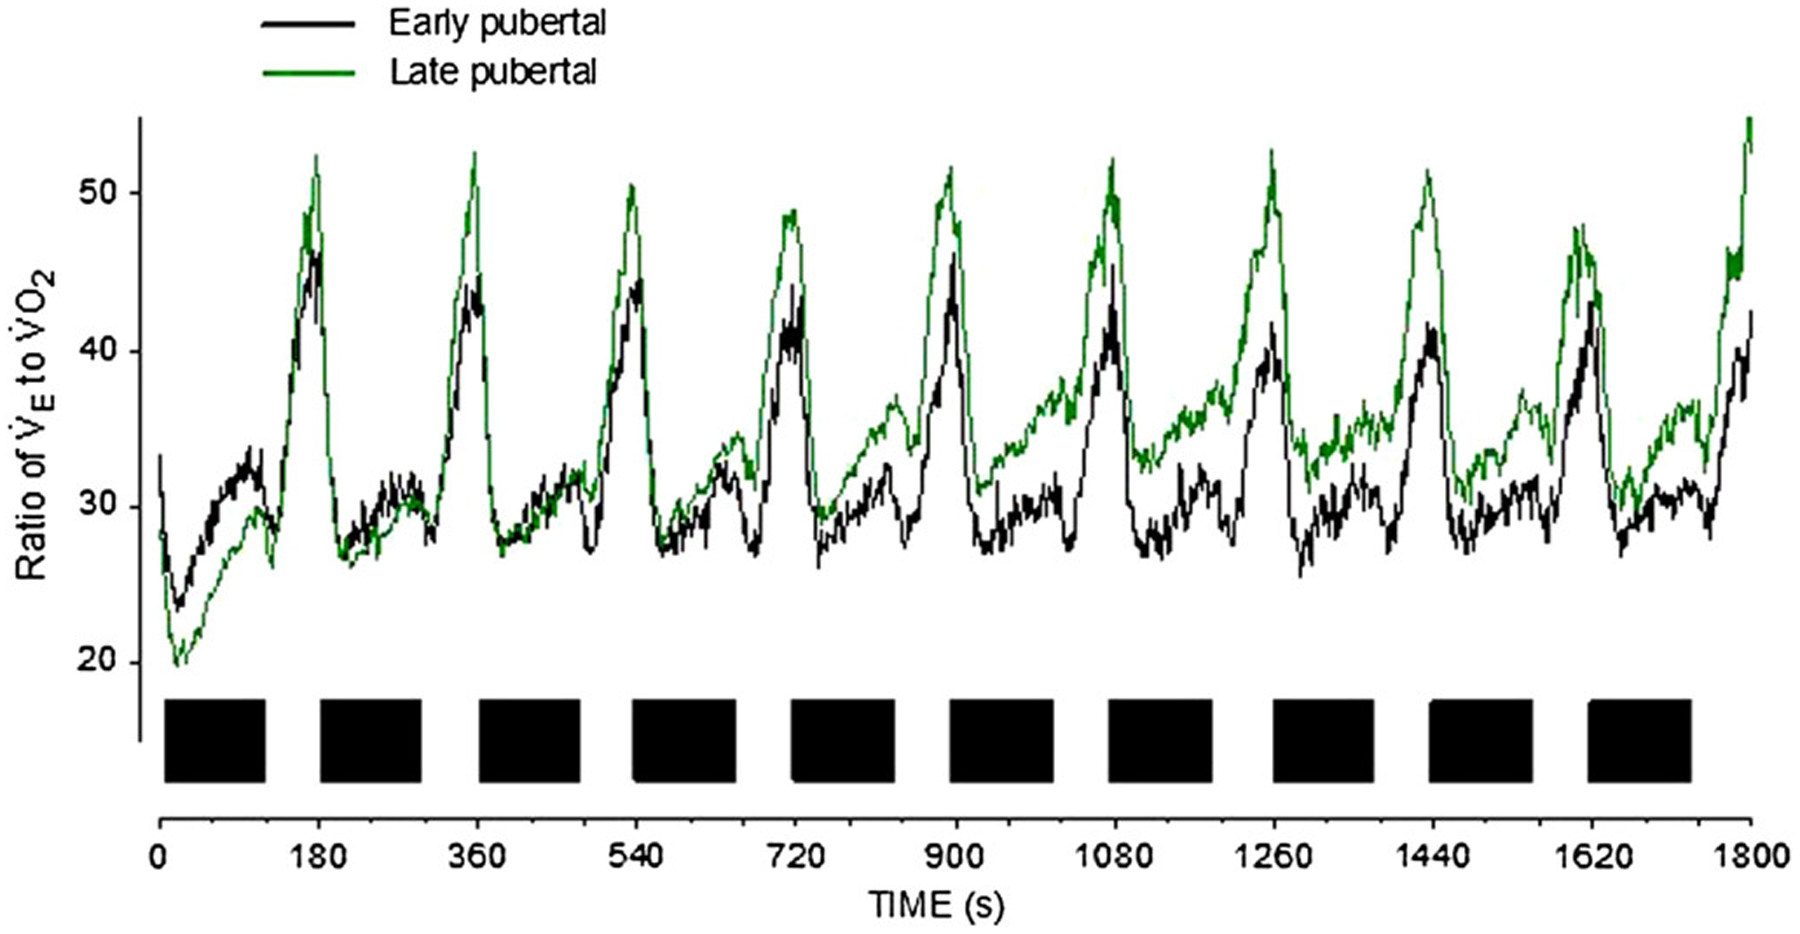
Figure 10 —

A series of constant work rate exercise bouts (closed squares) reveals striking maturational differences in the relationship between ˙VE and ˙VO2. This ratio (related to the oxygen uptake efficiency slope in standard CPET) is proving useful as a biomarker in a variety of cardiac and pulmonary diseases. Note the value of a test that uncovers data during both the onset and recovery from a brief exercise bout. CPET indicates cardiopulmonary exercise testing; ˙VO2, oxygen consumption.
