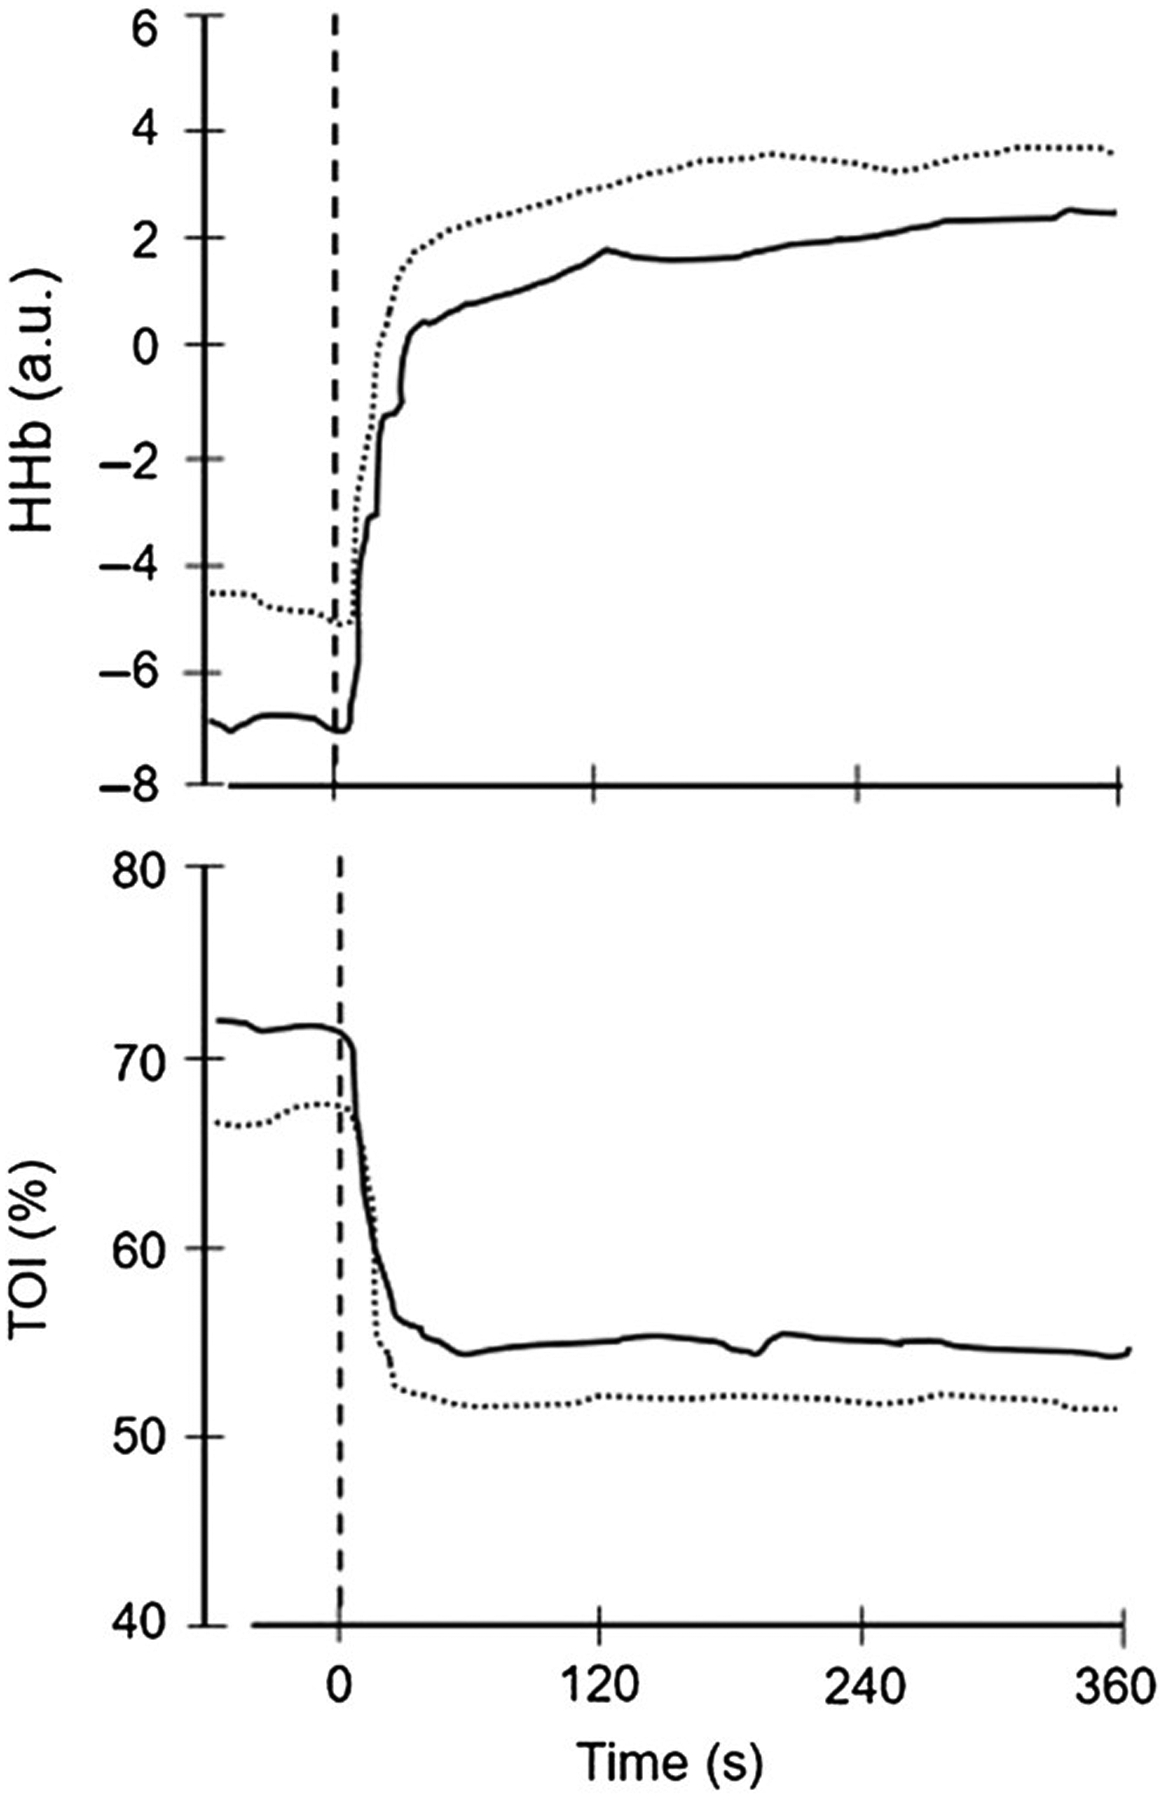
Figure 8 —

Mean HHb (top panel) and TOI (bottom panel) dynamics obtained from near-infrared spectroscopy during an initial exercise bout (dotted line) rapidly followed by a repeat bout (solid line). The vertical dotted line signifies the onset of exercise. Note that in the second bout, the TOI is elevated at baseline and throughout the exercise transition. Despite this, exercise tolerance was not improved by the priming bout. Reprinted with permission from Barker et al (9). TOI indicates tissue oxidation index; HHb, deoxyhemoglobin.
