Table 3.
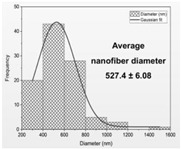
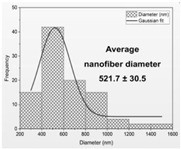
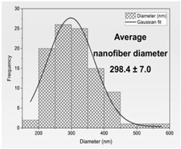
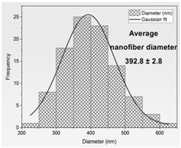
Faber distribution and average diameter of nanofibers N1–N4.
| N1 | N2 | N3 | N4 | |
|---|---|---|---|---|
| Fiber distribution |

|

|

|

|
| Diameter of nanofibers [nm] | 527.40 ± 6.08 c | 521.70 ± 30.50 c | 298.40 ± 7.00 a | 392.80 ± 2.80 b |
Using Duncan’s test, mean values within a column with the same letter do not differ substantially at p < 0.05; the lowest values are represented by the first letter of the alphabet, and statistically significant falling values by the following letter.
