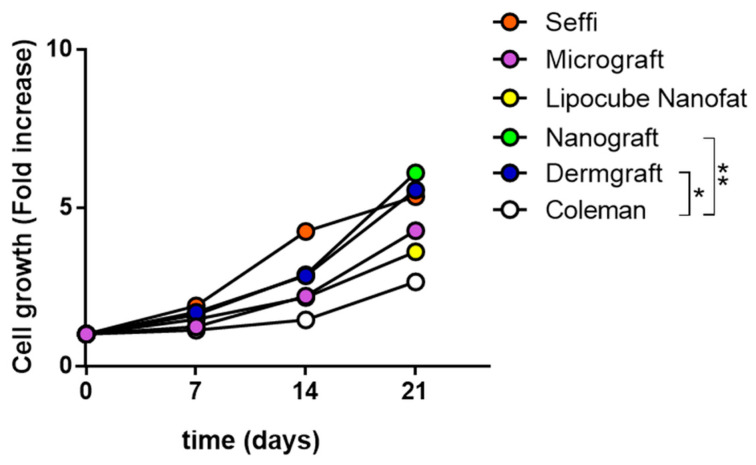
Figure 1.
Cell growth ability of the fat-derived groups. The X axis represents the different time points, and the Y axis represents the cell growth (calculated as a fold increase). The letters are related to the different techniques and associated with different colors: Coleman technique (White), Nanograft (Green), Lipocube Nanofat (Yellow), Seffi (Superficial Enhanced Fluid Fat Injection) (Orange), Dermgraft (Dark Blue), Lipocube Micrograft (Purple). Differences between experimental conditions were analyzed with a two-way ANOVA test and post hoc Tukey post-test. Quantitative data are expressed as means ± SEM: * p ≤ 0.05, ** p ≤ 0.01.

