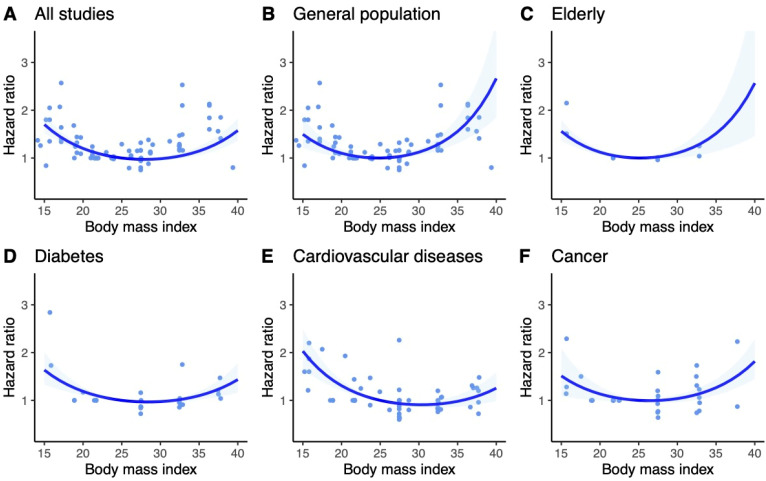
Figure 4.
Dose–response meta-analysis of studies investigating the association between BMI and risk of all-cause mortality in non-Asian population. BMI of 25 kg/m2 served as reference. Ribbons show 95% confidence intervals. Dots are estimates from individual studies. (A)—Univariate Cochran Q-test for residual heterogeneity: p-value < 0.001, I-square statistic = 87.0% (B)—Univariate Cochran Q-test for residual heterogeneity: p-value < 0.001, I-square statistic = 86.8% (C)—Univariate Cochran Q-test for residual heterogeneity: p-value < 0.001, I-square statistic = 0.0% (D)—Univariate Cochran Q-test for residual heterogeneity: p-value < 0.001, I-square statistic = 60.9% (E)—Univariate Cochran Q-test for residual heterogeneity: p-value < 0.001, I-square statistic = 91.5% (F)—Univariate Cochran Q-test for residual heterogeneity: p-value < 0.001, I-square statistic = 69.0%.

