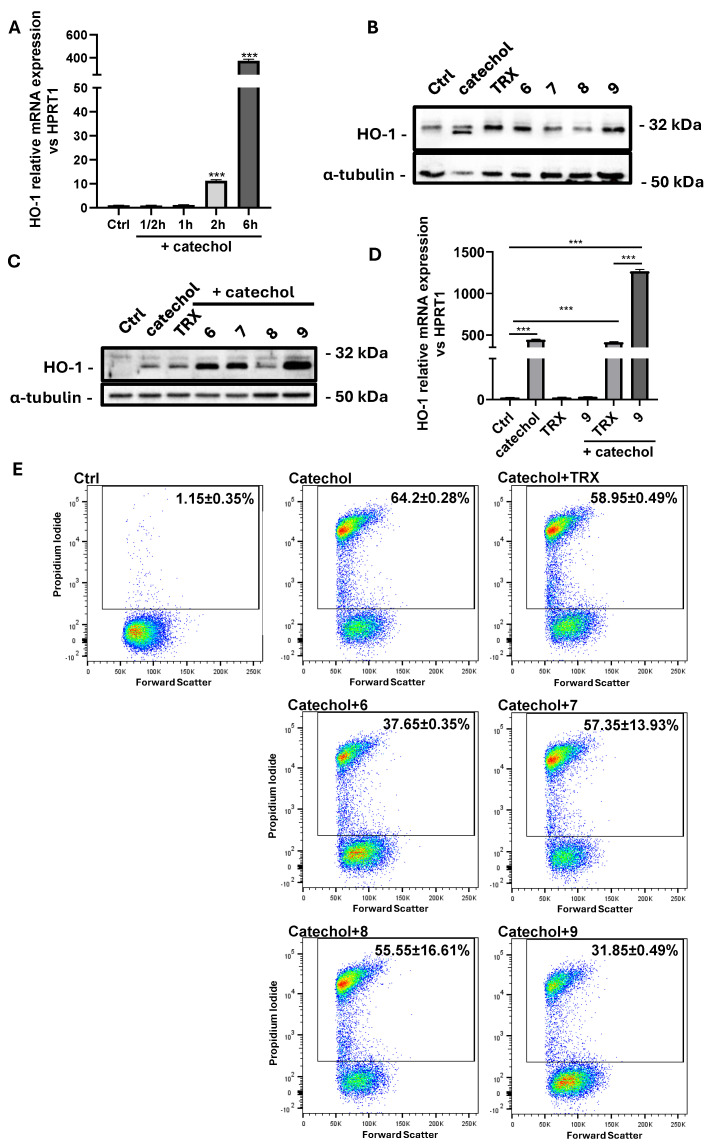
Figure 7.
Effects of the benzofuran-2-ones 6–9 on HO-1 expression and viability of differentiated SH-SY5Y cells exposed to catechol stress. (A) Real-time PCR analysis showing the time course (0–6 h) of induction of HO-1 mRNA expression under catechol stress in differentiated SH-SY5Y cells. Results are expressed as the mean ± SD of three independent experiments. Statistical significance was assessed by one-way ANOVA (***: p < 0.001). (B) Western blot analysis showing the expression of HO-1 protein in differentiated SH-SY5Y exposed or not (Ctrl) for 6 h to 10 μM catechol or to 10 μM benzofuran-2-ones (6, 7, 8 and 9). Trolox (TRX) was included as a reference antioxidant. (C) Western blot analysis showing the expression levels of HO-1 protein in differentiated SH-SY5Y exposed or not (Ctrl) for 6 h to 10 μM catechol in presence or not of 10 μM benzofuran-2-ones (6, 7, 8 and 9). Trolox (TRX) was included as a reference antioxidant. Results are expressed as the mean ± SD of three independent experiments. (D) Real-time PCR analysis showing HO-1 mRNA levels in differentiated SH-SY5Y cells exposed or not (Ctrl) for 6 h to 10 μM catechol and to 10 μM TRX or 9 in presence or not of 10 μM catechol. Results are expressed as the mean ± SD of three independent experiments. Statistical significance was assessed by one-way ANOVA (***: p < 0.001). (E) Cytofluorimetric analysis of propidium iodide (PI) staining showing necrotic differentiated SH-SY5Y cells (expressed as percentage) exposed or not (Ctrl) for 24 h to 10 μM catechol in presence or not of 10 μM benzofuran-2-ones (6, 7, 8 and 9). Trolox (TRX) was included as a reference antioxidant.

