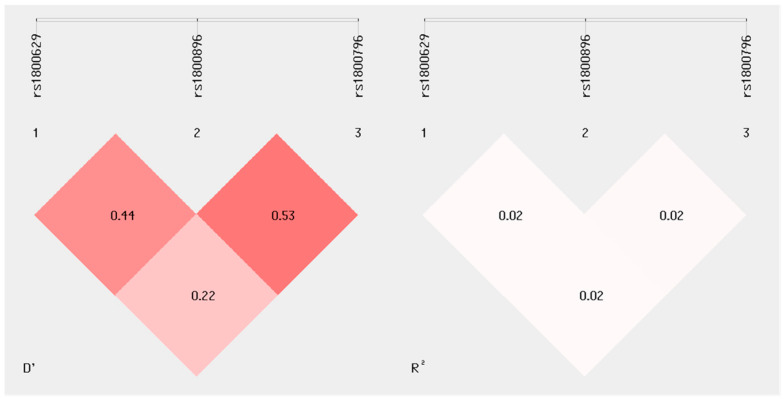
Figure 1.
Example analysis of allelic linkage disequilibrium (LD) of three selected SNPs (IL-10, IL-6 and TNFα) in the group of mothers. The calculations in the SHEsis plus program show the three selected SNPs of the genes IL-10, IL-6 and TNFα in the upper part. The lower part of the image shows the values of the allelic linkage disequilibrium (LD) for pairs of the specified polymorphism values of r2 and D’. Both values are standardized values for LD. If the values for the correlation coefficients r2 and D’ are closer to zero, the population is closer to equilibrium. The highest allelic linkage disequilibrium was observed between SNPs rs1800896 and rs1800876 concerning D’ values.

