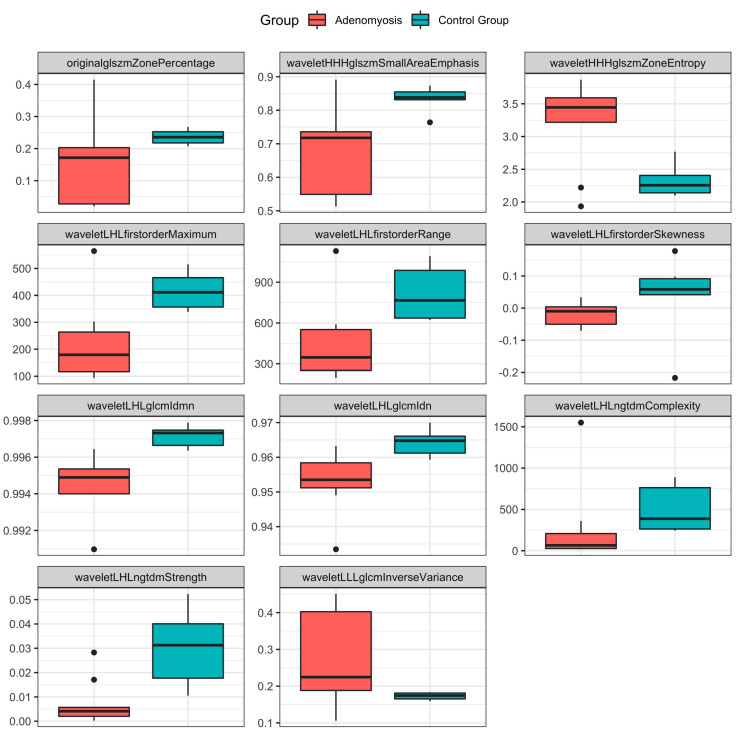
Figure 5.
Boxplots of radiomics features stratified by patient group. Boxplots showing the distribution of values for the 11 features, stratified by patient group. The lines in the boxes show the median, the lower and upper hinges correspond to the first and third quartiles, the upper/lower whiskers extend from the hinges to the largest/smallest values no further than 1.5 * interquartile range from the hinges. The black dots represent outliers.

