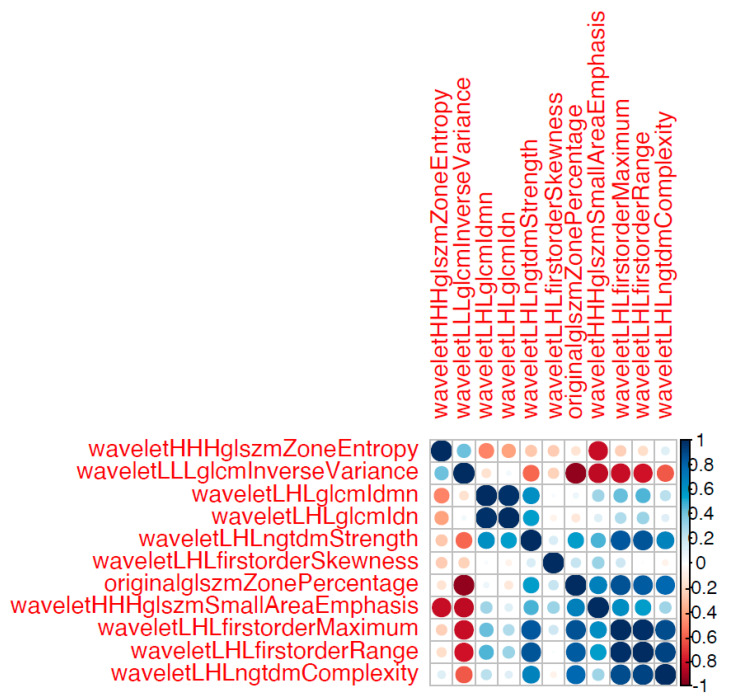
Figure 6.
Correlation matrix of all 11 remaining features. The color and size of the circles is proportional to the magnitude of the correlation between two given features (Pearson correlation coefficients) as shown in the legend on the right side of the figure. Five features stemming from clusters of highly correlated features were selected for model 2.

