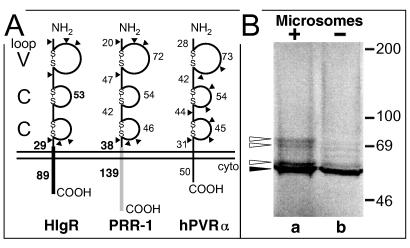
FIG. 3.
(A) Comparative schematic representation of the molecular structure of HIgR, PRR-1, and PVR. The V and C domains formed by cysteine bonds typical of this cluster of Ig superfamily members are shown, along with the number of residues in each region. The regions differing between HIgR and PRR-1, i.e., the transmembrane portion, the segment preceding it, and the cytoplasmic (cyto) tail, are in solid black for HIgR and shaded for PRR-1; the numbers of residues forming these latter regions are shown in bold type. Triangles indicate predicted N-glycosylation sites. (B) Electrophoretic mobility of HIgR synthesized by in vitro transcription-translation with 28.6 μCi of [35S]methionine (Radiochemical Center, Amersham, England) in the absence (lane b) or presence (lane a) of microsomes (Promega kit). Proteins were separated by denaturing electrophoresis in 8.5% polyacrylamide gels. The dried gel was analysed with a Bio-Rad PhosphoImager. The solid arrowhead points to unglycosylated precursor; the open arrowheads point to glycosylated species. The electrophoretic mobility of radioactive markers is shown on the right.

