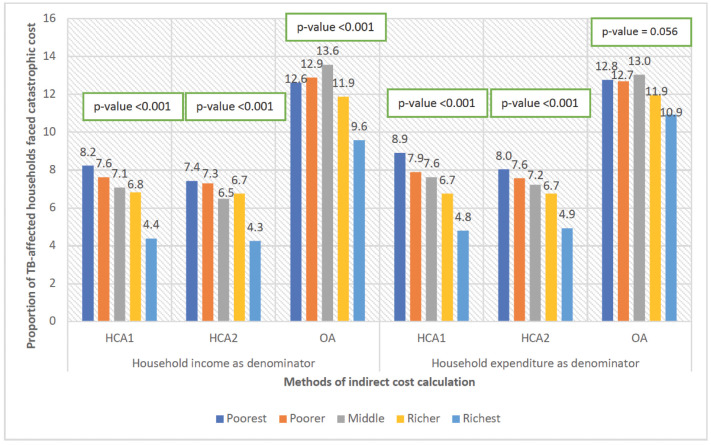
Fig 5. Proportion of TB-affected households with catastrophic cost, by wealth quintile (N = 1482).
Note: HCA1: Human capital approach where hours spent was calculated using minimum wage rate for all; HCA2: Human capital approach where hours spent was calculated using combination of patient wage and minimum wage; OA: Output approach.

