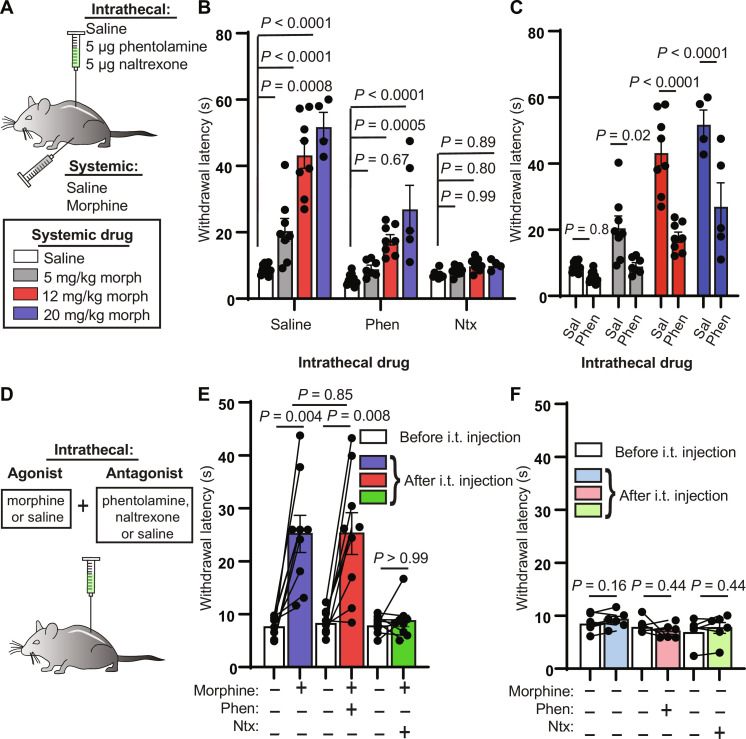
Fig. 1. Intrathecal noradrenergic and opioidergic antagonists attenuate systemic morphine antinociception.
(A) Schematic of intrathecal and systemic injection combinations and morphine doses. (B) Hot plate withdrawal latencies resulting from increasing doses (0, 5, 12, and 20 mg/kg, s.c.) of morphine grouped by intrathecal antagonist [saline versus 5 μg of phentolamine versus 5 μg of naltrexone; ordinary two-way analysis of variance (ANOVA) with Tukey’s multiple comparisons test; intrathecal drug effect, P < 0.0001, F2,81 = 95.35]. (C) Same data as in (B) from intrathecal saline and phentolamine groups reorganized by systemic morphine dose to facilitate comparisons (ordinary two-way ANOVA with Sidak’s multiple comparisons test; intrathecal drug effect, P < 0.0001, F1,52 = 63.07). (D) Intrathecal coadministration of morphine (2.5 μg) or saline with saline, phentolamine, or naltrexone. (E) Hot plate withdrawal latencies before (white) and after (blue, saline; red, phentolamine; green, naltrexone) intrathecal (i.t.) injection of morphine and antagonist (pre- versus post-intrathecal injection, n = 9 pairs each, two-sided Wilcoxon matched-pairs signed rank test; post-intrathecal morphine + saline versus post-intrathecal morphine + phentolamine, n = 9 saline, n = 9 phentolamine, two-sided Mann-Whitney test). (F) Hot plate withdrawal latencies before (white) and after (light blue, saline; pink, phentolamine; light green, naltrexone) intrathecal injection of saline and antagonist (pre- versus post-intrathecal injection, n = 6 pairs each, two-sided Wilcoxon matched-pairs signed rank test). All graphs depict means ± SEM.

