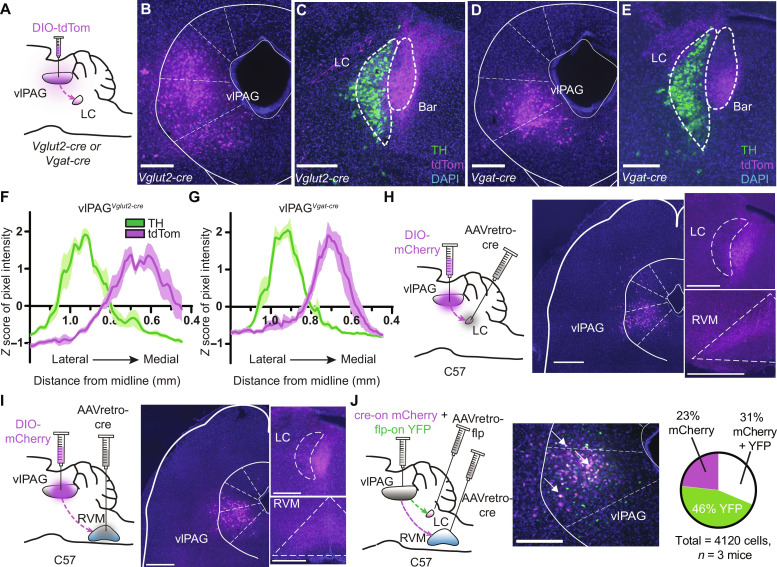
Fig. 4. Anatomical characterization of inputs to the LC from the vlPAG.
(A) vlPAG injection of AAV-DIO-tdTom in Vglut2- or Vgat-cre mice. (B) Vglut2-cre injection site. (C) vlPAGVglut2-cre terminals (magenta) and TH (green) in the peri-LC. Bar, Barrington’s nucleus. (D) Vgat-cre injection site. (E) vlPAGVgat-cre terminals. Scale bars, 300 μm [(B) to (E)]. (F) Quantification of magenta and green pixel intensity in the peri-LC of vlPAGVglut2-cre::tdTom mice normalized by z score (n = 6 LC slices from three mice). (G) Same as (F) for vlPAGVgat-cre::tdTom. (H) Left: Injections of AAVretro-cre in the LC and AAV-DIO-mCherry in the vlPAG of wild-type mice. Middle: Image of mCherry+ vlPAG neurons. Right: Resulting terminals in the LC and RVM. Scale bars, 500 μm. (I) Same as (H) for vlPAG→RVM neurons. Scale bars, 500 μm. (J) Left: Orthogonal recombinase strategy to label vlPAG neurons that project to the RVM and LC. Middle: Representative image of mCherry (magenta) and YFP (green). Arrows indicate double-labeled (white) neurons. Scale bar, 300 μm. Right: Quantification of mCherry and YFP in the vlPAG.

