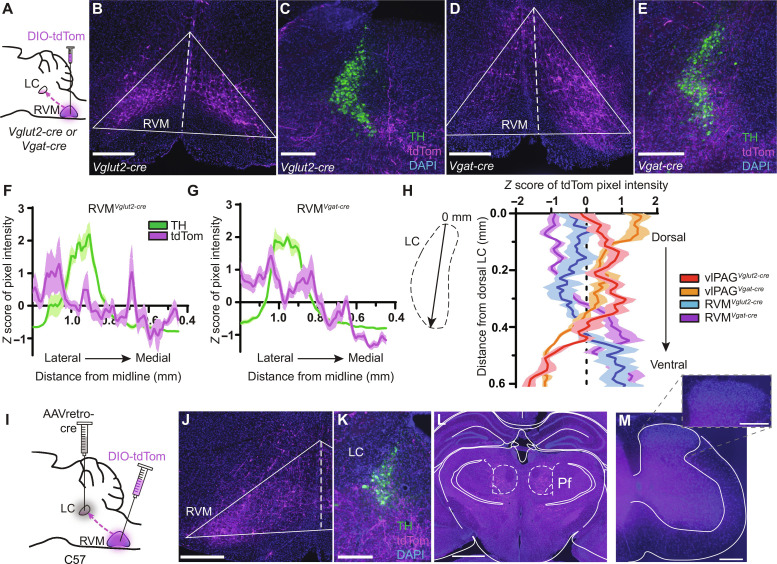
Fig. 5. Anatomical characterization of inputs to the LC from the RVM.
(A) RVM injection of AAV-DIO-tdTom in Vglut2- or Vgat-cre mice. (B) Vglut2-cre injection site. (C) RVMVglut2-cre terminals (magenta) and TH (green) in the peri-LC. (D) Vgat-cre injection site. (E) RVMVgat-cre terminals. Scale bars, 300 μm (B to E). (F) Quantification of magenta and green pixel intensity in the peri-LC of RVMVglut2-cre::tdTom mice normalized by z score (n = 6 LC slices from three mice). (G) Same as (F) for RVMVgat-cre::tdTom. (H) Quantification of terminal intensity across the somatic LC DV axis for all projection origin and cell type combinations (n = 6 LC slices from three mice each). (I) Injections of AAVretro-cre in the LC and AAV-DIO-tdTom in the RVM of wild-type mice. (J) tdTom+ RVM neurons. (K) Resulting terminals in the LC and peri-LC. Scale bars, 300 μm [(J) and (K)]. (L) tdTom+ fibers in the bilateral thalamic parafascicular nucleus. Scale bar, 1 mm. (M) Representative lumbar spinal section. Inset: Zoom in of the dorsal horn. Scale bars, 300 μm.

