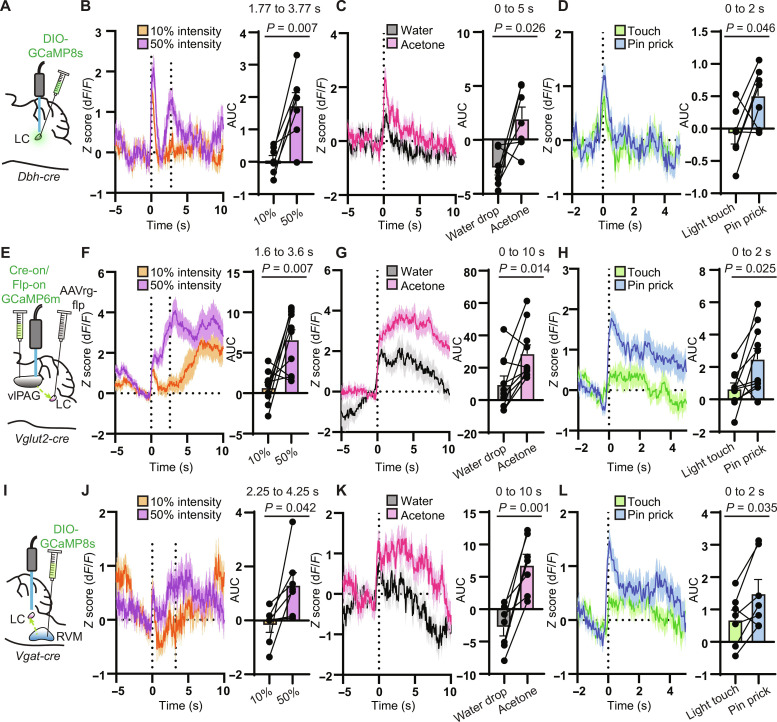
Fig. 7. LC, vlPAG→LC, and RVM→LC neurons are responsive to noxious stimuli.
(A) Injection of AAV-DIO-GCaMP8s in Dbh-cre mice and fiber placement in the right LC. (B) Left: Normalized fluorescence change during the Hargreaves assay at 10% (orange) and 50% (purple) light intensity with light on at t = 0 s. The average withdrawal response to 50% intensity occurred at 2.77 s (n = 7 mice, 6 trials each). Right: AUC analysis per mouse from 1 s before to 1 s after the paw withdrawal (two-sided paired t test: t = 4.012). (C) Left: Fluorescence response to acetone or room temperature water on the hind paw (n = 7 mice, 4 trials each). Right: AUC analysis from 0 to 5 s (two-sided paired t test: t = 2.944). (D) Left: Fluorescence response to light touch with a 0.16-g von Frey fiber versus pin prick (n = 7 mice, 6 trials each). Right: AUC analysis from 0 to 2 s (two-sided paired t test: t = 2.510). (E) Injection of AAVretro-FlpO in the LC of Vglut2-cre mice and Cre-on/Flp-on GCaMP6m with fiber over right PAG. (F) Same as (B) for vlPAG→LC neurons. Average withdrawal at 2.60 s (n = 10 mice, 6 trials each; two-sided paired t test: t = 3.507). (G) Same as (C) for vlPAG→LC. AUC analysis taken from 0 to 10 s (n = 10 mice, 4 trials each; Wilcoxon matched-pairs signed rank test). (H) Same as (D) for vlPAG→LC (n = 10 mice, 6 trials each; two-sided paired t test: t = 2.698). (I) Injection of AAV-DIO-GCaMP8s in the RVM of Vgat-cre mice with fiber over right LC. (J) Same as (F) for RVM→LC terminals. Average withdrawal at 3.25 s (n = 7 mice, 6 trials each; two-sided paired t test: t = 2.570). (K) Same as (G) for RVM→LC terminals (n = 7 mice, 4 trials each; two-sided paired t test: t = 5.646). (L) Same as (H) for RVM→LC terminals (n = 7 mice, 6 trials each; two-sided paired t test: t = 2.721). Graphs represent means ± SEM.

