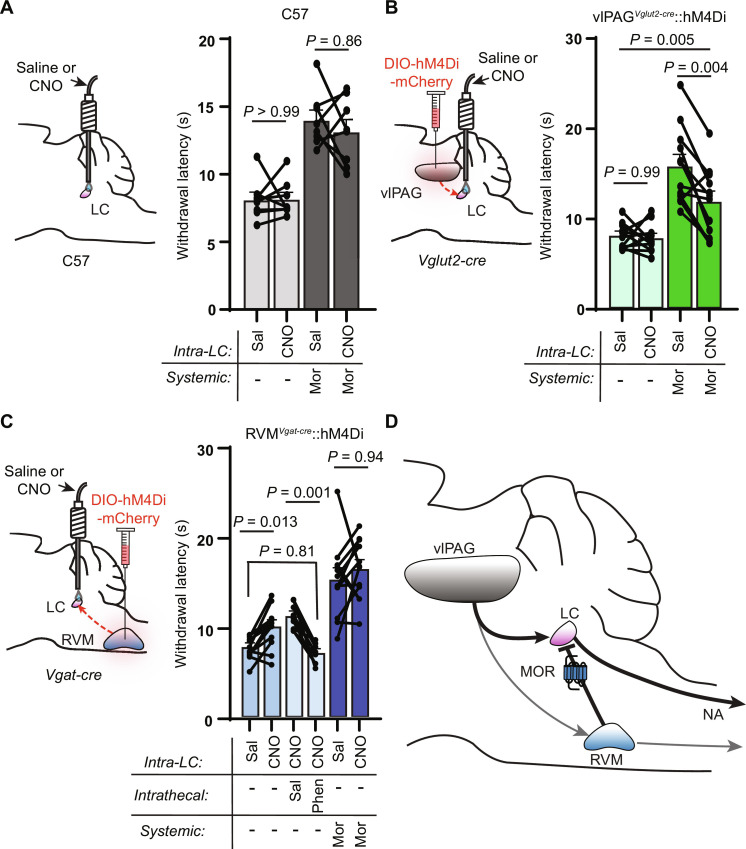
Fig. 8. Pathway-specific modulation of vlPAG and RVM terminals in the LC modulates nociceptive behavior.
(A) Left: Bilateral cannula placement over the LC in uninjected control mice. Right: Hot plate withdrawal latencies of control mice microinfused in the LC with saline (150 nl) versus CNO (3 μM, 150 nl) without (light gray) and with morphine (5 mg/kg s.c.) (dark gray; two-way repeated-measures ANOVA with Tukey’s multiple comparisons test; n = 8 mice; saline versus CNO effect, P = 0.4178, F1,7 = 0.7412). (B) Left: Bilateral viral injection of AAV-DIO-hM4Di-mCherry in the vlPAG of Vglut2-cre mice with bilateral cannula placement over the LC. Right: Hot plate withdrawal latencies after microinfusion with saline versus CNO without (light green) and with morphine (5 mg/kg s.c.) (dark green; two-way repeated-measures ANOVA with Sidak’s multiple comparisons test; n = 12 mice; saline versus CNO effect, P = 0.0022, F1,11 = 15.72). (C) Left: Bilateral viral injection of AAV-DIO-hM4Di-mCherry in the RVM of Vgat-cre mice with bilateral cannula placement over the LC. Right: Hot plate withdrawal latencies after microinfusion of saline versus CNO (blue bars, n = 12 mice), microinfusion of CNO with intrathecal injections of saline versus phentolamine (5 μg, light blue bars, n = 9 mice), and microinfusion of saline versus CNO with morphine (5 mg/kg s.c.) (dark blue, n = 12 mice; mixed-effects analysis with matching across row and Tukey’s multiple comparisons test, P < 0.0001, F2.560,25.09 = 27.36). (D) Circuit diagram of DPMS inputs to the LC and their opioid sensitivity. Data in each graph reported as means ± SEM.

