Figure 3.
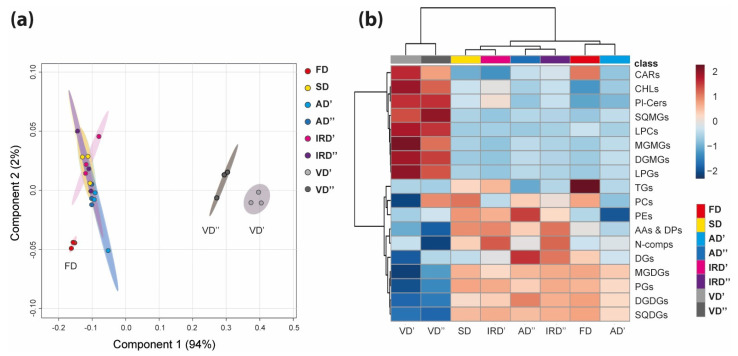
Global metabolic features of the studied dried spirulina powders. (a) The score plot represents the partial least squares discriminant analysis (PLS-DA) of LC-MS data. Ellipses represent clusters (95% confidence regions); A (b) heatmap visualization of 18 metabolites classes after the drying of the spirulina. The red-blue color scale indicates the summed up peaks intensity being higher or lower than the average. Each column indicates a different drying method (FD, freeze drying; SD, sun drying; AD′, air drying at 40 °C; AD″, air drying at 75 °C; IRD′, infrared drying at 40 °C; IRD″, infrared drying at 75 °C; VD′, vacuum drying at 40 °C; VD″, vacuum drying at 75 °C) and each row indicates a different metabolite class (AAs & DPs, amino acids and dipeptides; CARs, carotenoids; CHLs, chlorophylls and derivatives; DGs, diacylglycerols; DGDGs, digalactosyl diacylglycerols; DGMGs, digalactosyl monoacylglycerols; LPCs, lysophosphatidylcholine; LPGs, lysophosphatidylglycerols; MGDGs, monogalactosyl diacylglycerols; MGMGs, monogalactosyl monoacylglycerols; N-comps, other polar nitrogen compounds; PCs, phosphatidylcholines; PEs, phosphatidylethanolamine; PGs, phosphatidylglycerols; Pl-Cers, ceramide phosphoinositols; SQDGs, sulfoquinovosyl diacylglycerols; SQMGs, sulfoquinovosyl monoacylglycerols; TGs, triacylglycerols).

