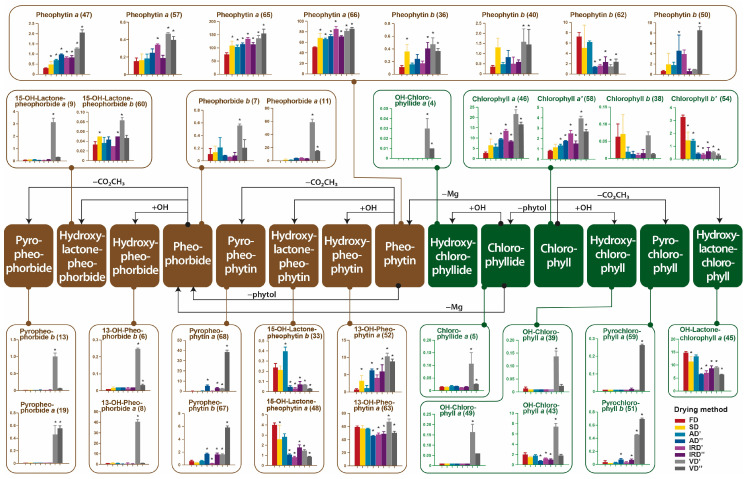
Figure 6.
Mapping of chlorophylls’ degradation pathways and the dynamic variations of chlorophylls and derivatives in the ethanolic extracts prepared from spirulina dried using different methods (FD, freeze drying; SD, sun drying; AD′, air drying at 40 °C; AD″, air drying at 75 °C; IRD′, infrared drying at 40 °C; IRD″, infrared drying at 75 °C; VD′, vacuum drying at 40 °C; VD″, vacuum drying at 75 °C). Data are presented as the mean ± SD (n = 3) of mass spectrometric intensity (107). Values marked with asterisks are significantly different (Dunnett’s t test; p < 0.05) from those of the control sample (FD). The compound numbers correspond to the numbers in Table S1.

