Figure 1.
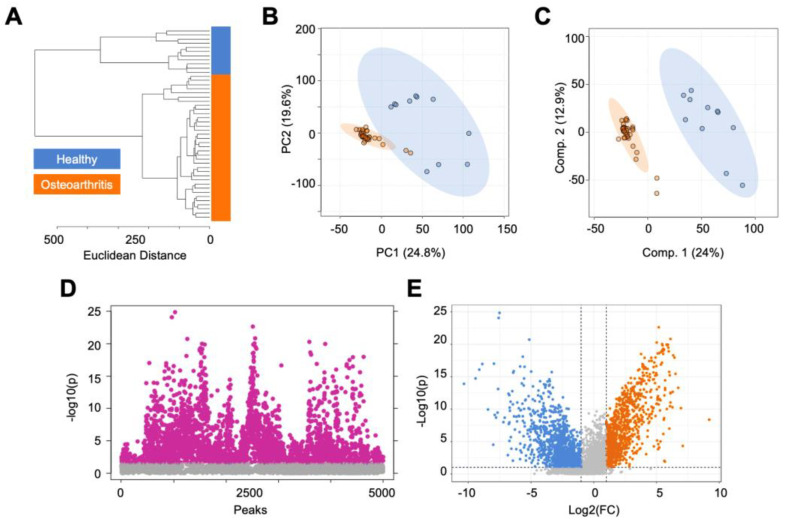
The metabolomic profiles of human cartilage from healthy and osteoarthritis patients are metabolically distinct. (A) Hierarchical clustering analysis found that healthy and osteoarthritic cartilage samples cluster separated from each other. (B) Principal component analysis, an unsupervised test, found a minimal overlap of principal components 1 and 2, accounting for 44.4% of the variability in the dataset. (C) Partial least-squares discriminant analysis, a supervised test, showed complete separation of healthy and diseased cartilage samples, with components 1 and 2 accounting for 36.9% of the variability in the dataset. (D) T-test analysis detected 2842 metabolite features, with a false discovery rate-adjusted p-value less than 0.05. (E) Volcano plot analysis, using fold change and statistical significance, distinguished differentially regulated metabolites between healthy and diseased cartilage. Specifically, 1010 metabolite features were more abundant in diseased cartilage compared to healthy cartilage (log2(FC) > 2, p < 0.05), whereas 1399 were more abundant in healthy cartilage compared to diseased cartilage (log2(FC) < −2, p < 0.05). Orange = osteoarthritis. Blue = healthy.

