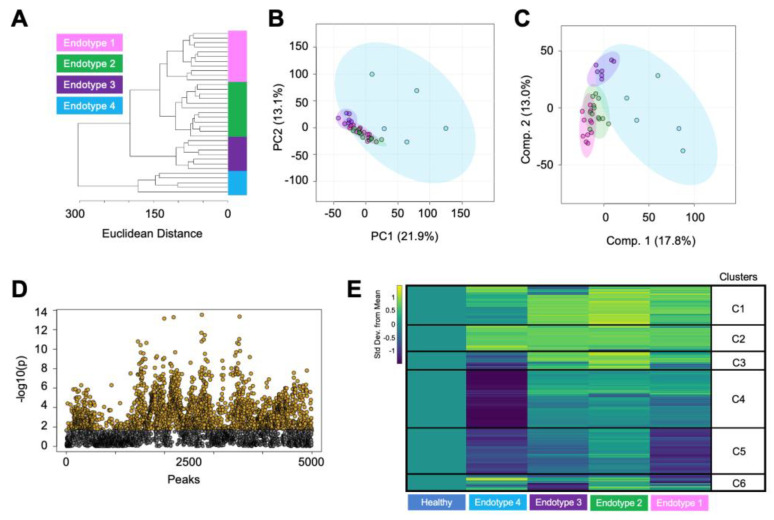
Figure 2.
Metabolomic assessment of osteoarthritic cartilage classifies unique patient endotypes. (A) Hierarchical clustering of cartilage from patients with osteoarthritis showing that they clustered into 4 distinct endotypes. (B) These endotypes were further examined and visualized by principal component analysis. Principal components 1 and 2 accounted for 35% of the variability in the dataset and showed a moderate overlap of the osteoarthritis endotypes. (C) Partial least-squares discriminant analysis slightly refined the separation of the groups with components 1 and 2, accounting for 30.8% of the variability in the dataset. (D) ANOVA analysis detected 2506 metabolite features with a false discovery rate-adjusted p-value less than 0.05. (E) Metabolite features distinguished by ANOVA were visualized using a median metabolite intensity heatmap, where the osteoarthritis endotypes were normalized to healthy cartilage. Heatmap clusters of co-regulated metabolite features (C1–C6) that were differentially regulated across the OA endotypes were then subjected to pathway analyses to pinpoint distinct metabolomic endotypes across osteoarthritic cartilage. Columns represent endotype groups, and rows indicate metabolite features. Warmer colors (yellow) indicate higher metabolite abundance, whereas cooler colors (blue) indicate lower metabolite abundance. Endotype colors correspond to endotypes as follows: pink—endotype 1; green—endotype 2; purple—endotype 3; blue—endotype 4.

