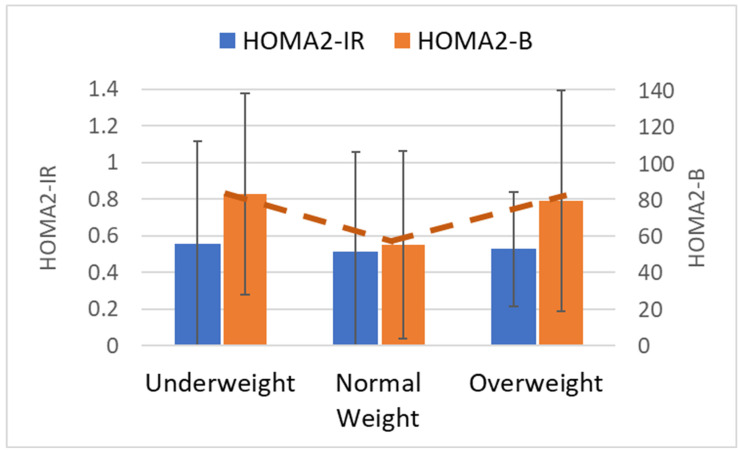
Figure 2.
Assessment of static beta cell function and insulin resistance at the time of birth from cord blood. Static beta cell function (HOMA2-B, right-sided y-axis, orange bars) was lowest in normal weight and was associated with weight group in a U-shaped relationship, as illustrated by the dotted orange line. Insulin resistance (HOMA2-IR, shown on left y-axis, blue bars) did not vary between groups. Underweight n = 63; normal weight n = 43; overweight n = 29.

