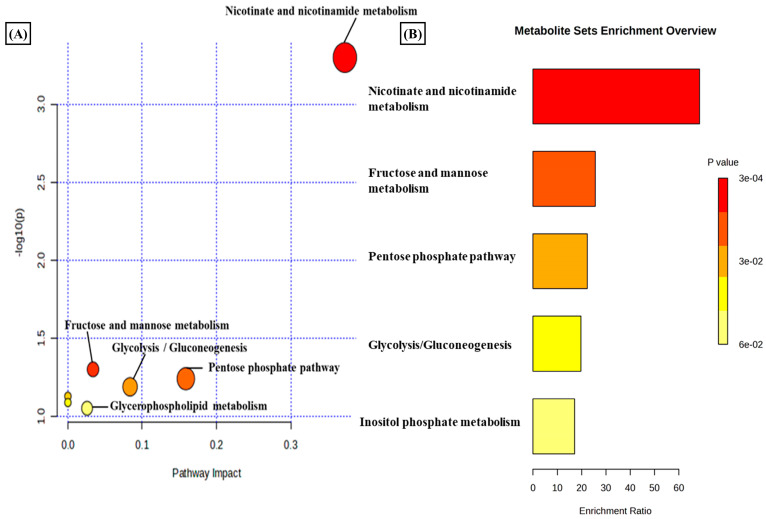
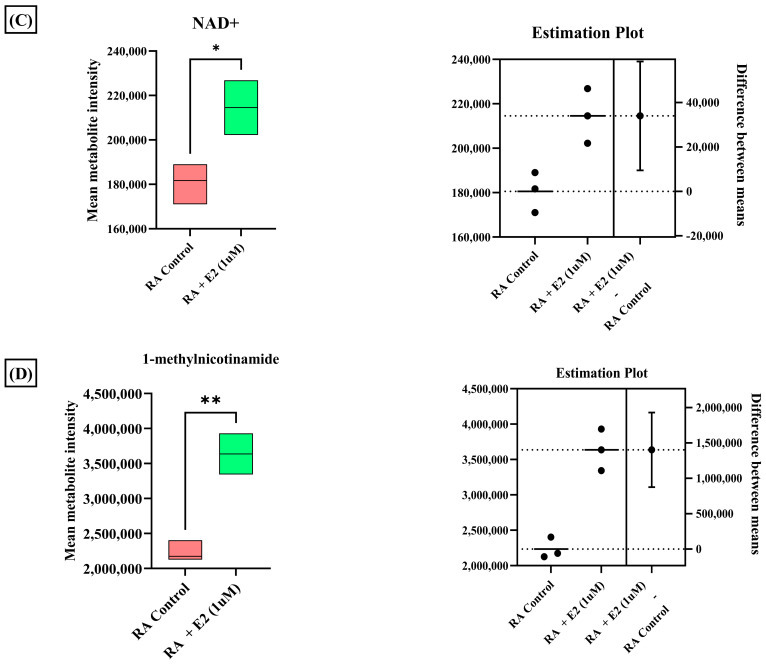
Figure 3.
(A) KEGG pathway analysis of eight significant metabolites (p < 0.05) as analyzed by MetaboAnalyst 6.0. (B) Histogram Representation of KEGG enrichment analysis of the eight significant metabolites. Cellular metabolite responses between untreated RA-FLS and E2-treated RA-FLS groups were expressed by mean metabolite intensity calculated by LC-MS analysis. (C) Box plot of mean metabolite intensity of NAD+. (D) Box plot of mean metabolite intensity of 1-methynicotinamide (1-MNA). Error bars represent the standard error of the mean (n = 3 each). * p < 0.05, ** p < 0.01.


