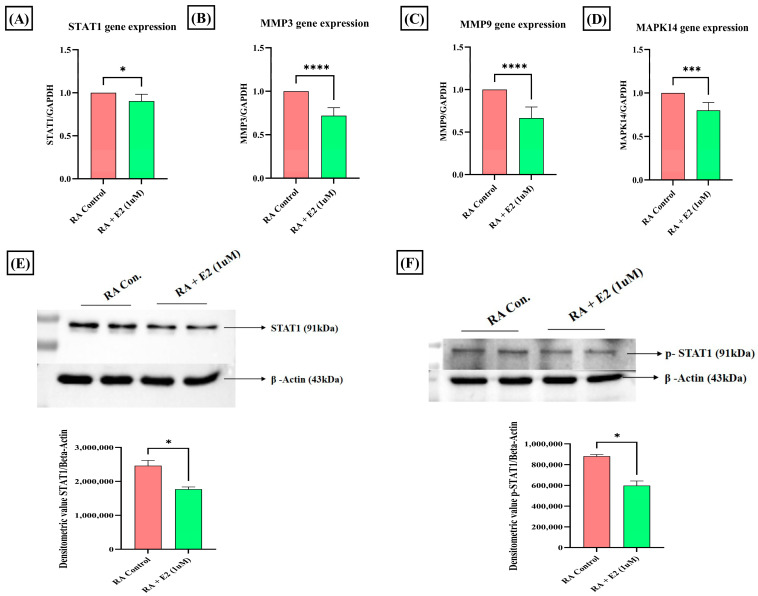
Figure 5.
Effect of 1 uM E2 induction for 24 h in RA-FLS on STAT1, p-STAT1, MMPs, and MAPK14 as analyzed by RT-PCR and Western blot analysis compared to untreated RA-FLS as control. (A,E) Relative gene and protein expression of STAT1. (B,C) Relative gene expression of MMP3 and MMP9. (D) Relative gene expression of MAPK14. (F) Relative protein expression of the phosphorylated form of STAT1 (p-STAT1). GAPDH was used as internal control for RT-PCR. Beta-actin was used as loading control for Western blotting. Data are presented as the mean ± standard deviation, * p < 0.05, *** p < 0.001, **** p < 0.0001.

