
Fig. 4.
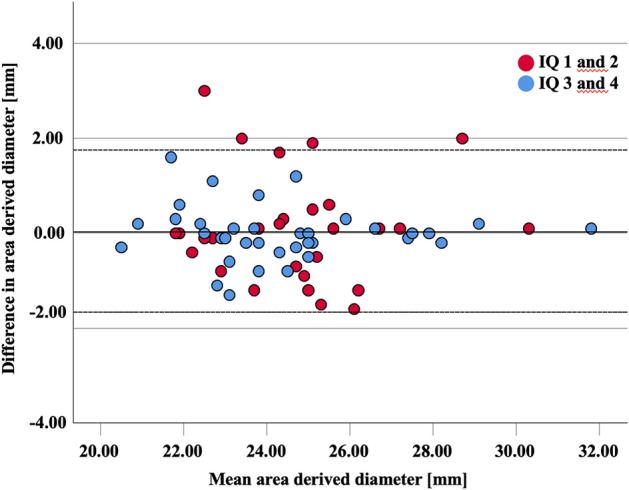
Bland–Altman plot shows measurements of mean area derived diameters performed on high-pitch spectral CT-Angiography (HPS-CTA) compared to Ultrahigh-resolution CT-Angiography, serving as the reference standard. No systematic bias between both methods is observed. The difference between the measurements do not vary systematically with the size of the measurements. A very strong agreement can be appreciated when HPS-CTA presented high subjective image quality (score values 3 and 4–lower and upper limits of −1.2 and 1.1 mm when). For patients with fair or poor image quality (score values of 2 or 1), a larger limit of agreement is noticed (lower limit and upper limit of −2.2 and 2.3 mm, respectively)