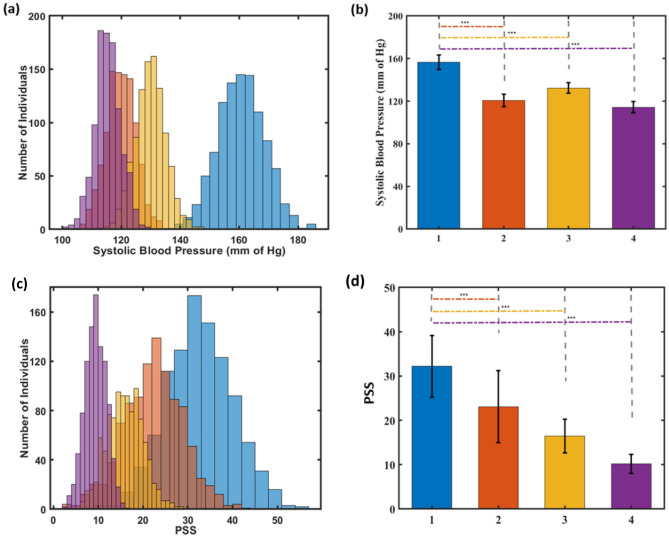
Figure 4.
Population analysis comparing intervention effect on SBP and PSS for physical and mental stress respectively. (a) Population dynamics for change in SBP, (b) Mean change in SBP levels (c) Population dynamics for change in PSS. (d) Mean change in PSS. Plot representation (Blue: Under stress, without intervention; Red: Under Stress, only with micronutrients; Yellow: Under stress, only with mixture of botanical extracts; Purple: Under stress, with combination of botanical extracts and micronutrients). Student’s t-test indicates ***p < 0.005.

