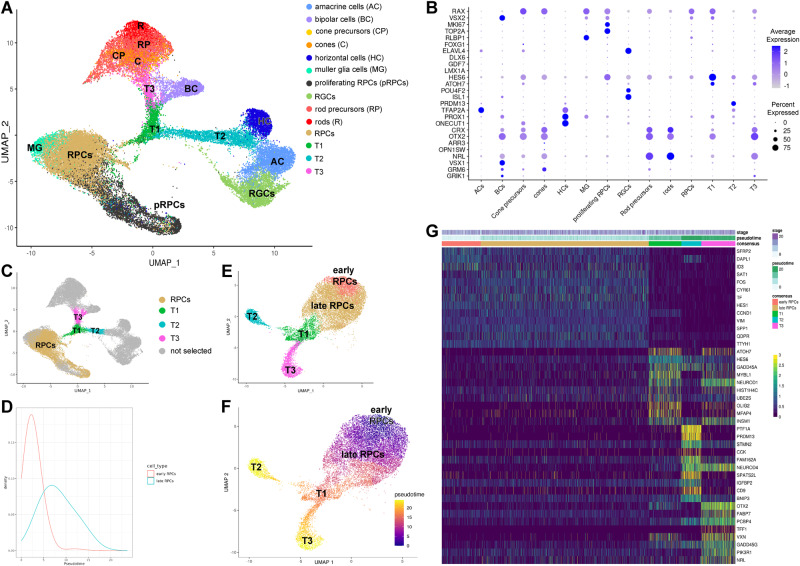
Fig. 1. RPCs identification and their developmental trajectories during human retinal development.
A UMAP plot of integrated scRNA-Seq foetal retina cells. Each cluster was identified based on expression of retinal specific cell markers. Highly expressed markers for each clusters are shown in Supplementary Data 2. B Dotplot showing highly expressed marker genes for each retinal cell type identified in the integrated scRNA-Seq data. C RPCs and transient neurogenic progenitors named T1, T2 and T3 were identified. Highly expressed markers for each cluster along the pseudotime trajectory are shown in Supplementary Data 2. D Density plot of RPC pseudotime scores showing a bimodal distribution corresponding to the early and late RPCs. E, F Pseudotime analysis demonstrating transition from early to late RPCs, and to T1 progenitors, which further commit to either T2 or T3 transient neurogenic progenitors. G Gene expression heatmap showing similarities in gene expression patterns between early and late RPCs, but distinct gene expression signatures in T1, T2 and T3 neurogenic progenitors.

