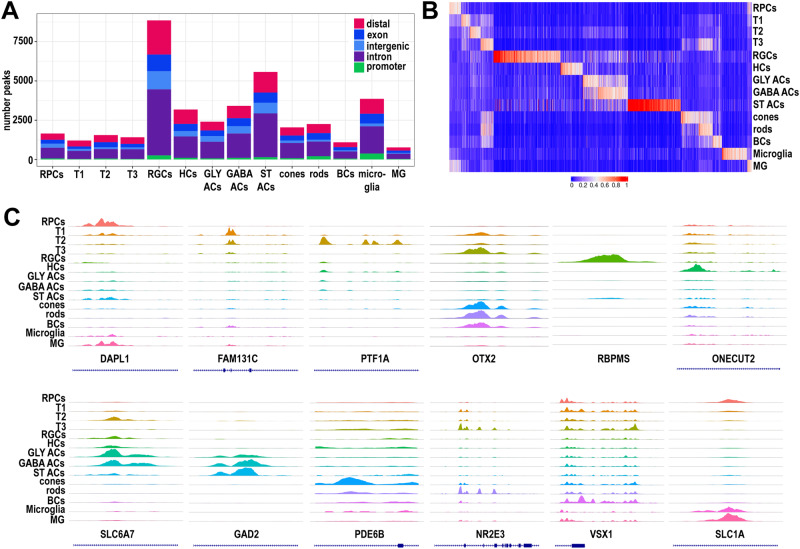
Fig. 4. Single cell ATAC-Seq analysis of developing retina samples reveals cell type specific chromatin accessibility profiles.
A The number and type of chromatin accessibility profiles for each cell type. B Heatmap showing differentially accessible of chromatin accessibility peaks (columns) for each cell type (rows). C Representative examples of chromatin accessibility peaks for retinal cell specific marker genes. Each track represents the aggregate scATAC signal of all cells from the given cell type normalized by the total number of reads in TSS regions.

