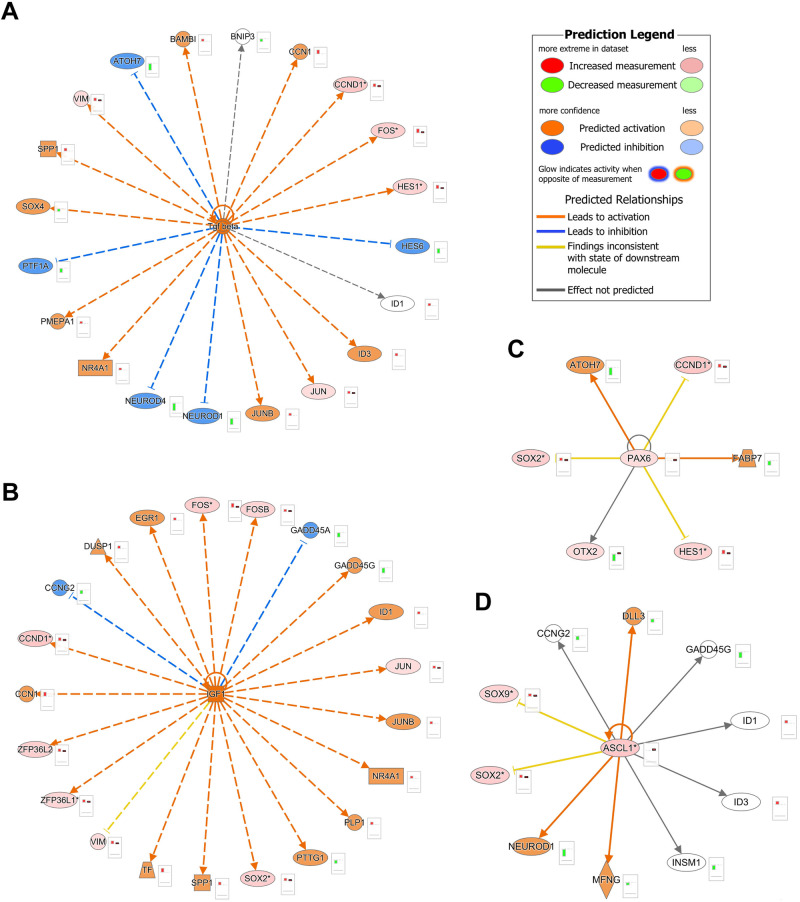
Fig. 6. Gene regulatory networks in RPCs.
Representative gene regulatory networks in RPCs depicting activated upstream regulators (A, B) and inhibited upstream regulators (C, D) and their target genes. Upstream regulatory networks were generated with IPA using differentially expressed genes from the scRNA-Seq data and differential accessibility analysis in the scATAC-Seq data. The networks show predictions of upstream regulators which might be activated or inhibited to explain observed upregulation/downregulations in the data. The barplots next to each molecule represent the relative expression in the sRNA-Seq (column 1) and scATAC-Seq datasets (column 2). The colours for the network nodes/barplots indicate observed upregulation/ increased chromatin accessibility (red), predicted upregulation/increased chromatin accessibility (orange), observed downregulation (green) and predicted downregulation/ decreased chromatin accessibility (blue). The colour of the edges represents the relationships between the molecules; orange = prediction and observation are consistent with activation; blue = prediction and observation are consistent with downregulation; yellow = prediction and observation are inconsistent; and grey relationship between the molecules is available in the IPA knowledge database. *- indicates duplicates in scATAC-Seq dataset.

