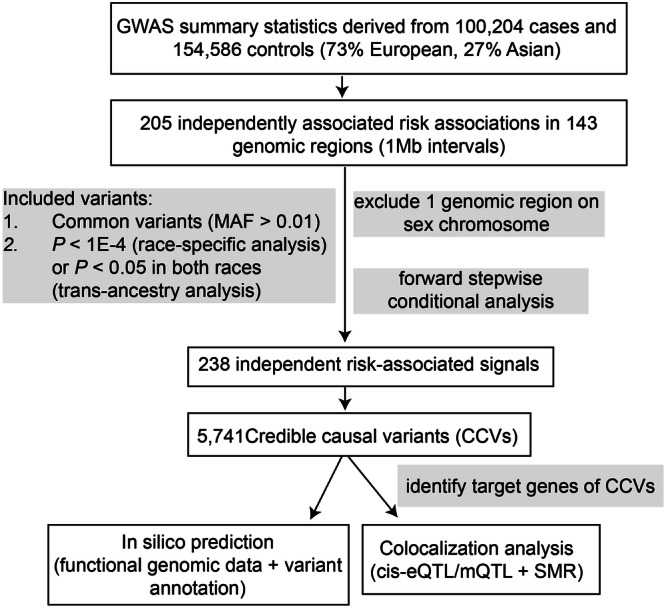
Fig. 1. Schematic diagram of the study design.

We conducted fine-mapping analyses using GWAS summary statistics from 100,204 cases and 154,587 controls. All 205 genetic variants were aggregated to 143 risk regions containing at least a 1 megabase (Mb) interval centered on the most significant association. This study focused on 142 risk regions located on the autosomes. In forward stepwise conditional analysis, we included common variants (minor allele frequency (MAF) > 0.01) with associations at P < 0.05 in both populations for the trans-ancestry analysis and with associations at P < 1 × 10⁻⁴ in each population for race-specific analysis. The threshold of conditional P < 1 × 10⁻⁶ was used to determine independent risk-associated signals. For credible causal variants (CCVs) for each independent signal, we conducted in-silico analyses with functional genomic data generated in CRC-related tissues/cells and colocalization of expression/methylation quantitative trait loci (e/mQTL) with GWAS signals to identify putative target genes for CCVs using the Summary-data-based Mendelian Randomization (SMR) approach.
