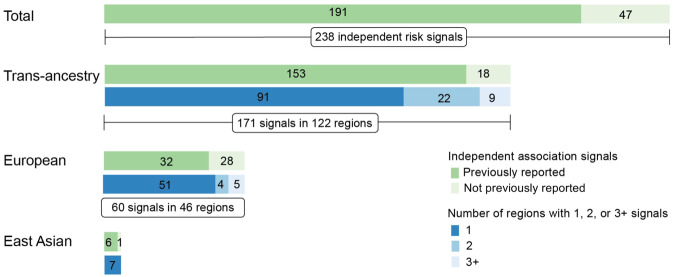
Fig. 2. Independent association signals for colorectal cancer risk.
Numbers of fine-mapping regions and numbers of independent association signals identified through forward stepwise conditional analyses. The second bar for “Trans-ancestry”, “European” and “East Asian” also shows the number of regions with 1, 2, or 3+ signals per region. The green color indicates the number of independent association signals previously reported or not yet reported. The blue color indicates the number of independent associaiton signals in each risk region.

