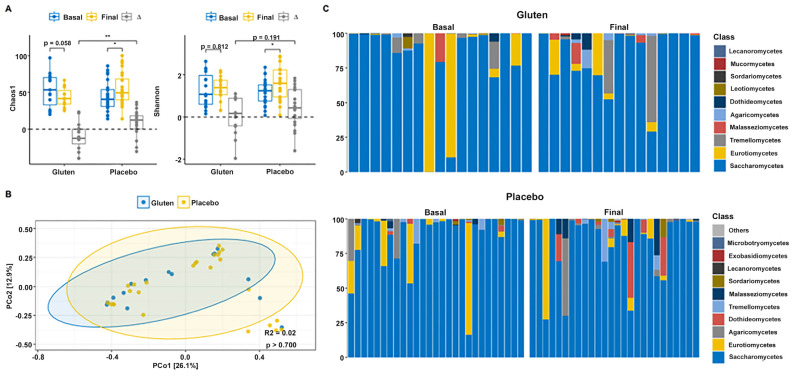
Figure 2.
Gut fungal diversity and composition of participants according to study group. (A) Chao1 (left) and Shannon (right) alpha diversity indices in the gluten (n = 15) and placebo (n = 24) groups. (B) Principal coordinate analysis (PCoA) based on the Bray–Curtis distance. (C) Relative abundance of the 10 dominant fungal classes in the gluten (top) and placebo (bottom) groups according to basal and final time. ∆ = Final − Basal. * p < 0.05; ** p < 0.01.

