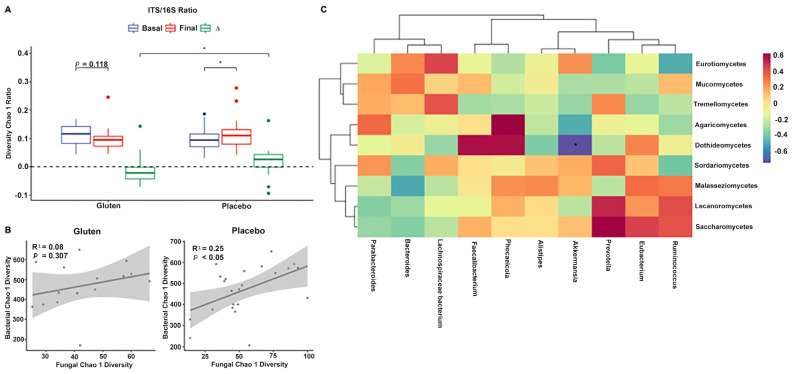
Figure 4.
Relationship between fungi and bacteria after the intervention. (A) Internal transcribed spacer (ITS)/16S ratio of Chao1 richness index. (B) Linear regression of fungal and bacterial Chao1 diversity indices in the gluten (left, n = 15) and placebo (right, n = 24) groups. (C) Hierarchical clustering of correlations using the Spearman’s test between bacterial genera (bottom) and fungal classes (right side) in the gluten group. ∆ = Final − Basal. * p < 0.05 (ITS/16S), * false discovery rate < 0.05 (heatmap).

