Figure 3.
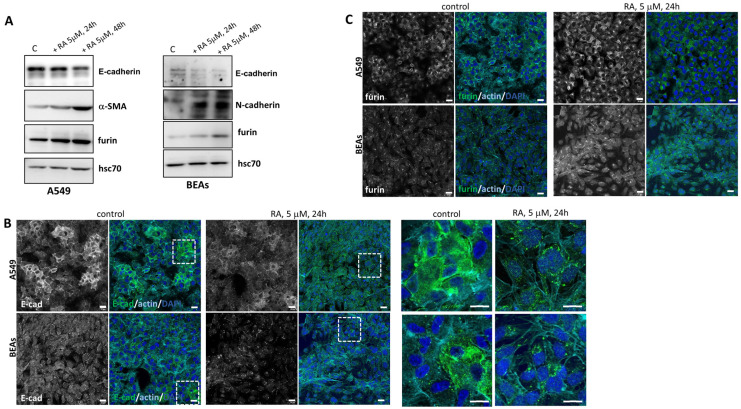
Effect of RA addition in vitro in human lung cell lines. (A) Western blot analysis showed the expression of different EMT markers and furin in two cell lines (A549 and BEAs) after incubation with 5 μM RA at 24 h and 48 h. Hsc70 was used as a loading control. A representative image is shown (n = 3 independent cultures). (B) Localization of E-cadherin (green), detected by immunofluorescence staining in A549 and BEA cells after 5 μM RA treatment for 24 h. Zoom has been made around the dotted lines and magnified images are shown on the right side. (C) Representative IF analysis of furin (green) in lung cell lines (A549 and BEAs) after 24 h of RA incubation (5 μM). In both (B,C), nuclei were stained with DAPI and F-actin with phalloidin (cyan blue). Scale bars 20 μM and 60 μM for zoom images in (B).

