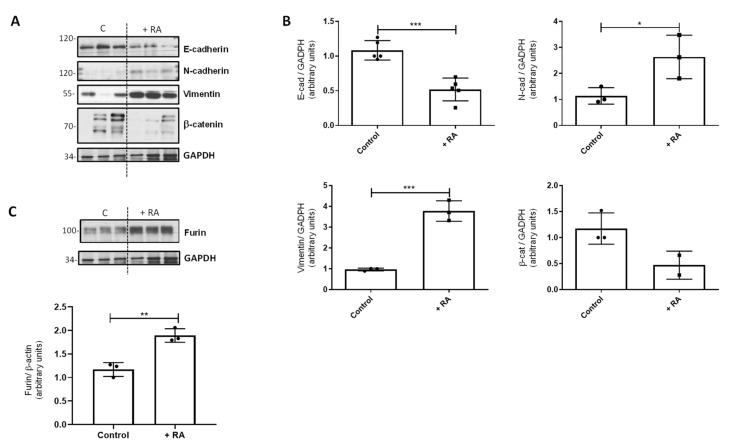
Figure 4.
Effect of RA addition in vivo on EMT markers. (A) Western blot analysis to study the levels of different EMT markers in vivo in control rats after RA treatment (+RA group). GAPDH was used as a loading control. (B) Quantification of the Western blots is shown in panel (A). Data (n ≥ 3 different animals) were quantified, normalized with GAPDH, and plotted as mean fold ± SD vs. control. (C) Western blot analysis of furin in control rats after RA treatment (+RA group) (n = 3); GAPDH was used for normalization and quantification (mean fold ± S.D. vs. control). For all quantifications, asterisks indicate significant differences: * p ≤ 0.05; ** p ≤ 0.01, or *** p ≤ 0.001.

