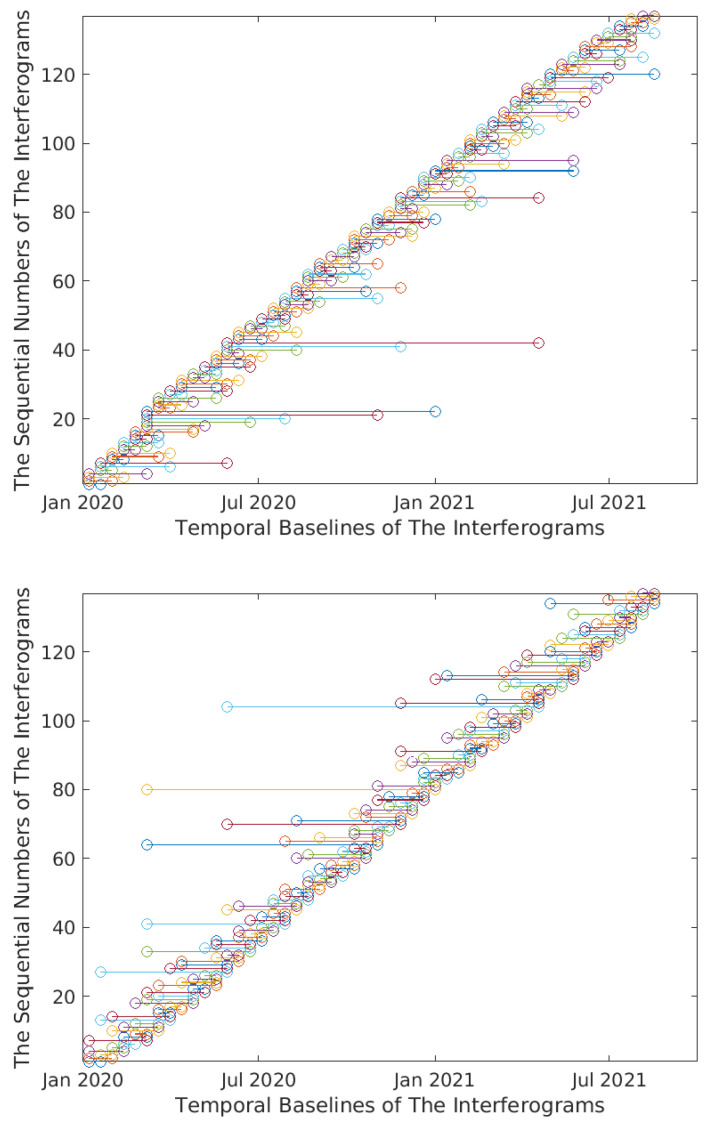
Figure 6.
The chronological sorting of the temporal baselines of the wrapped interferograms (Lombardy Dataset). Top figure expresses the sequence of the temporal baselines of the interferograms before sorting. Bottom figure expresses the sequence of the temporal baselines of the interferograms after sorting. Similar results have been obtained for the other two datasets of Lisbon and Washington.

