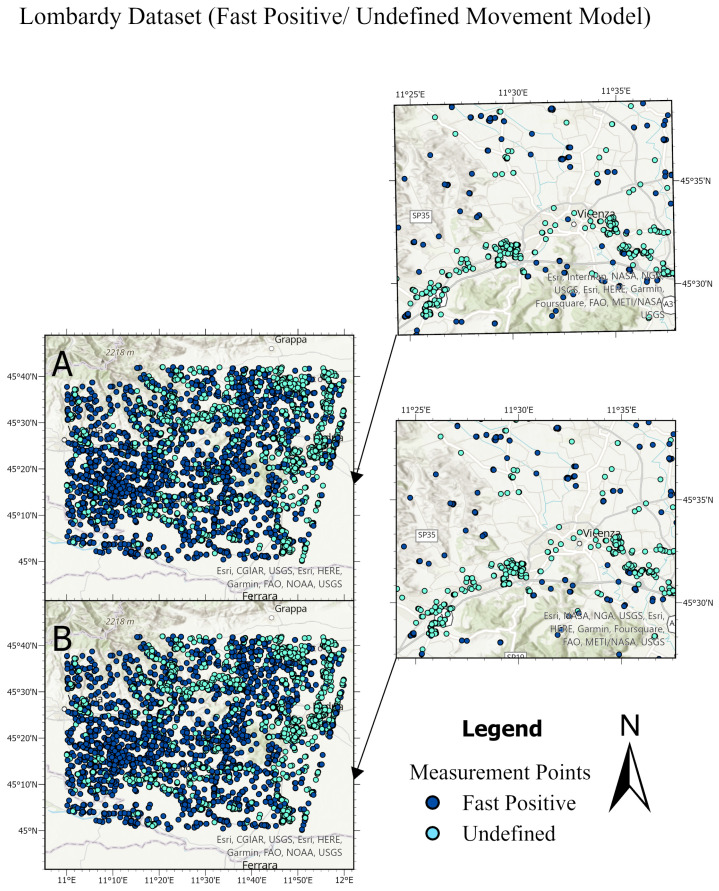
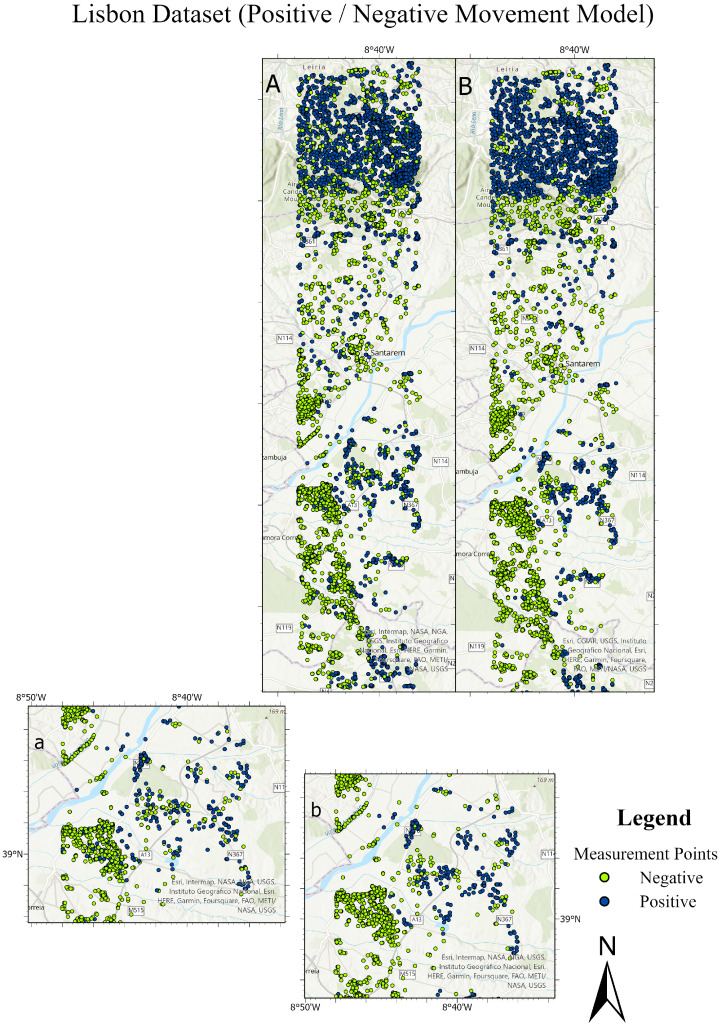
Figure 20.
Comparison between the ground truth and the predictions of the test sets for different datasets. Top main figure: Lombardy dataset, showing fast positive and undefined movements. Bottom main figure: Lisbon dataset, displaying positive and negative movements. Each main figure consists of four subfigures. In the top subfigure, Subfigure (A) presents the ground truth of the Lombardy test set, with Subfigure (a) providing a detailed close-up of Subfigure (A). Subfigure (B) shows the predictions for the Lombardy test set, with Subfigure (b) offering a close-up of these predictions. Similarly, in the bottom main figure for the Lisbon dataset, Subfigure (A) and Subfigure (a) focus on the ground truth test set and its close-up, respectively, while Subfigure (B) and Subfigure (b) depict the predictions and their close-up.


