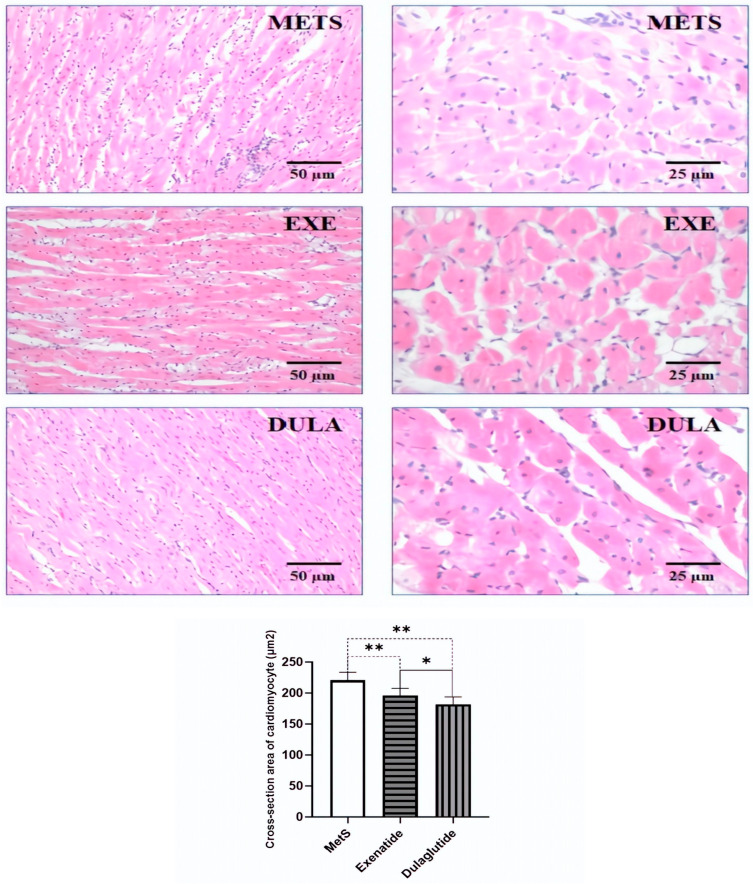
Figure 6.
Representative micrograph of H&E staining of the cardiac muscle. Left row (objective magnification 20×, bar = 50 μm). Right row (objective magnification 40×, bar = 25 μm). METS: metabolic syndrome group; EXE: group of rats treated with exenatide; DULA: group of rats treated with dulaglutide. Graph represents values of the cross-section area of the cardiomyocyte of all groups. All values are the mean value ± SD. Statistical significance at the level * p < 0.05, ** p < 0.01 vs. the adequate group, connected by a horizontal line.

