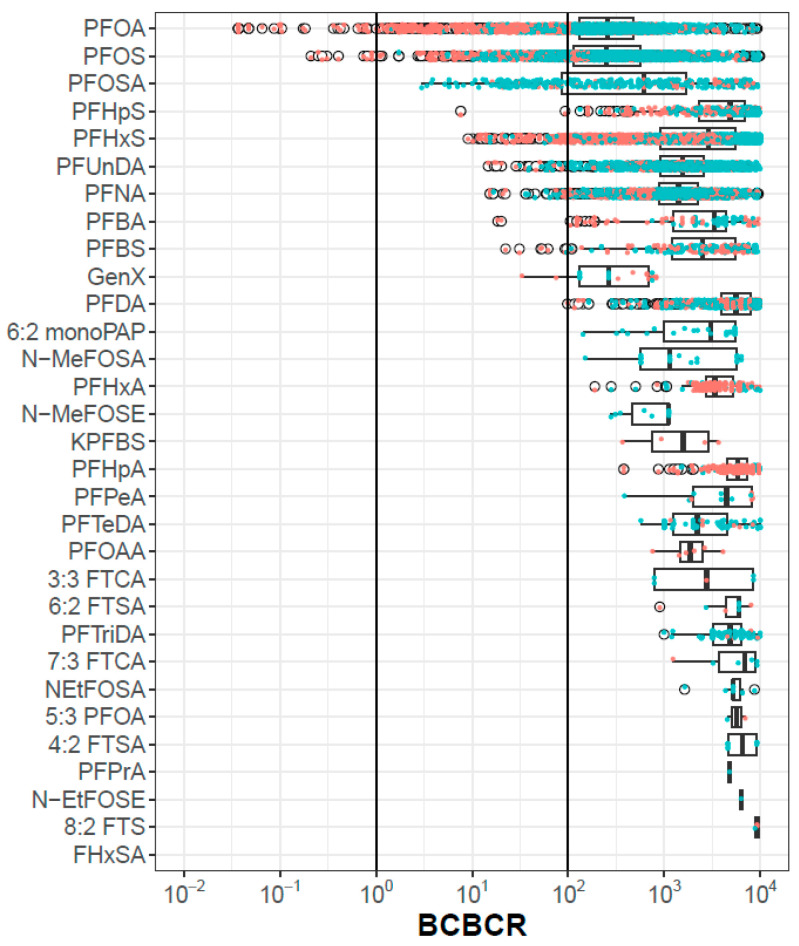
Figure 2.
BCBCR values as a function of chemical, metric and population. Each point is one population-metric value for one chemical. Points colored orange are from exposed populations and those colored blue are from general populations. The box and whiskers indicate the inner quartiles and 1.5 times the IQR, respectively. The open circles are points outside 1.5 times IQR.

