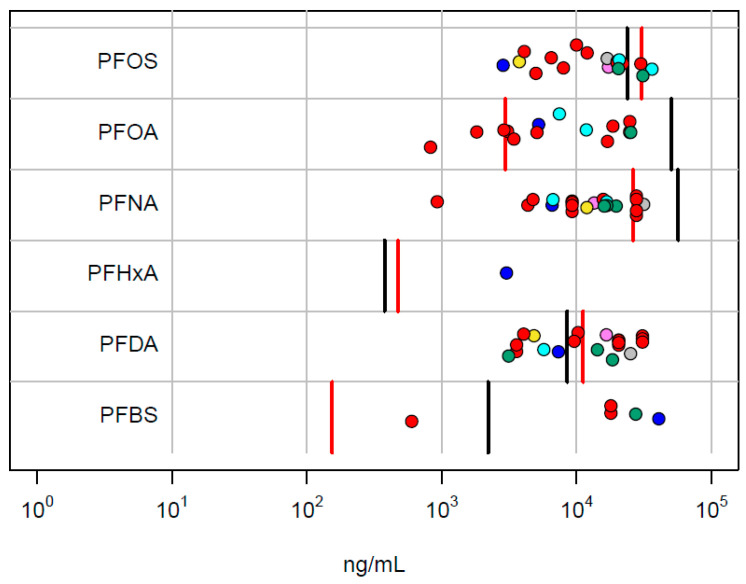
Figure 4.
Comparison of in vitro PODset values with internal concentrations corresponding to the lowest in vivo LEL values in the NTP study. Points correspond to the in vitro technologies (ACEA: violet; ATG: blue; BSK: red; HTPP: green; HTTr: cyan; Zebrafish: yellow; DNT: black; Thyroid: gray). The vertical lines are the POD concentrations for male (red) and female (black) rats.

