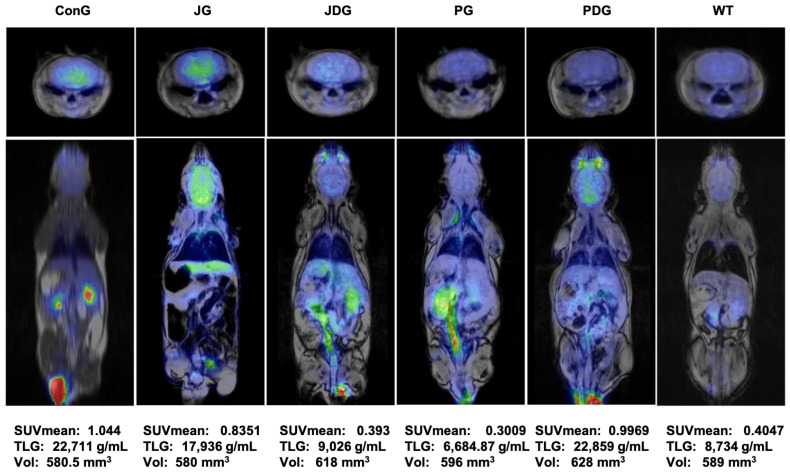
Figure 4.
PET-MRI imaging data of a representative animal from each group in the axial (the upper line) and coronal (middle line) planes. The average values of SUVmean, TLG, and VOIs for each group are presented on the bottom line. PET-MRI: Positron Emission Tomography—Magnetic Resonance Imaging; SUV: standardized uptake values; TLG: Total Lesion Glycolysis, a quantitative measure that combines both the metabolic activity and the volume of a lesion identified on a PET scan; VOIs: volumes of interest.

