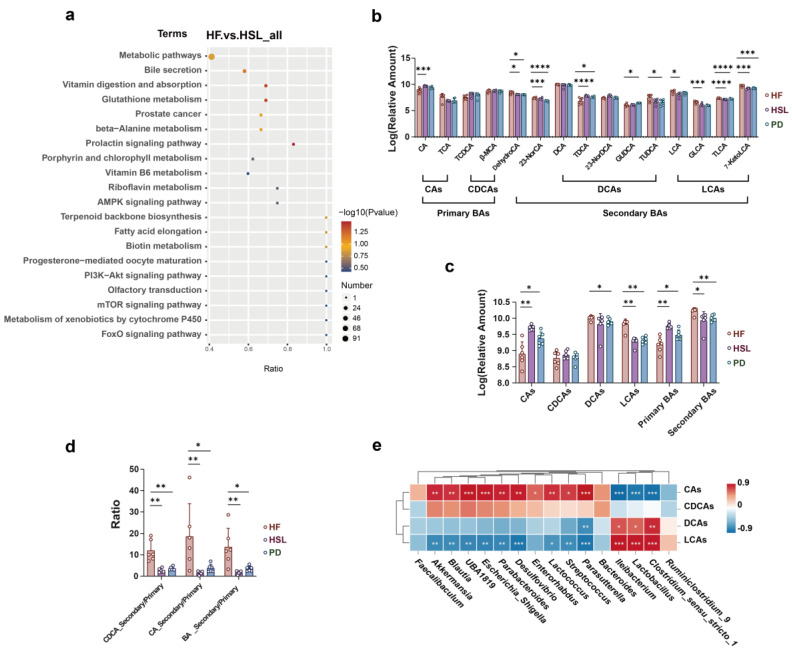
Figure 6.
Effect of silymarin and polyherbal extract intervention on fecal BAs profile and its correlation with microbial community. (a) Enriched KEGG pathways in HF group compared with HSL group shows the top 20 regulated metabolic pathways by silymarin intervention. Rich Factor was determined by the ratio of differential metabolites detected to total metabolites in that pathway. (b) Relative quantitative value of various BAs in feces. (c,d) Diagram shows the significant differences in the level of classified CAs, CDCAs, DCAs, LCAs, classified primary BAs and secondary BAs (c), and the ratio of secondary BAs to primary BAs from different sources (d). (e) The correlations between the abundance of selected differentially abundant genus with the relative level of fecal CAs, CDCAs, DCAs, LCAs and in HF and HSL mice were analyzed by two-sided Spearman’s correlation. n = 6 individuals/group and data were represented as mean ± SD, the differences between groups were calculated by two-sided Mann–Whitney test; * p < 0.05, ** p < 0.01, *** p < 0.001, **** p < 0.0001. CAs cholic acid and conjugates, CDCAs chenodeoxycholic acid and conjugates, DCAs deoxycholic acid and conjugates, LCAs lithocholic acid and conjugates.

