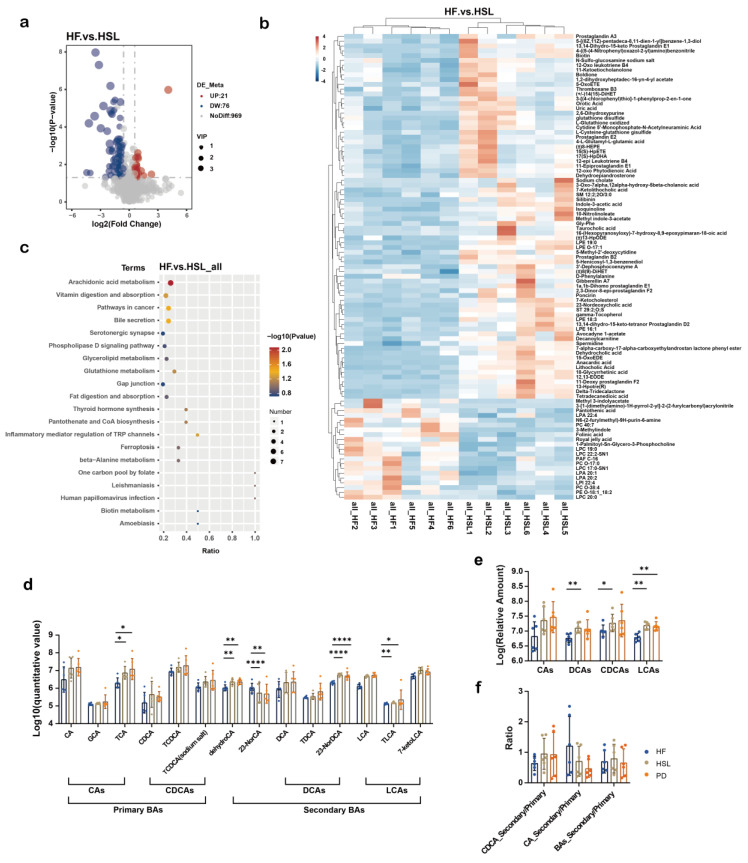
Figure 7.
Alterations of metabolites in the serum of NAFLD mice upon silymarin intervention. (a) Volcano plot shows the number of significantly changed metabolites in the serum (determined by Log2 FC and −Log10 p value) of HF compared to HSL mice. (b) Significantly differed metabolites between the serum of HF group and HSL group, blocks in red and blue denote high and low FC values, respectively. (c) Enriched KEGG pathways in HF group compared with HSL group shows the top 20 regulated metabolic pathways by silymarin intervention; Rich Factor was determined by the ratio of differential metabolites detected to total metabolites in that pathway. (d–f) Diagram showing the significant differences among groups in the relative level of BAs (d), the classified CAs, CDCAs, LCAs, DCAs obtained from non-targeted metabonomics (e) and the ratio of secondary BAs to primary BAs from different sources (f); n = 6. Significantly different metabolites were screened out by established PLS-DA model (VIP > 1 and p < 0.05) and values were shown as mean ± SD while two-sided Mann–Whitney nonparametric test were conducted for comparisons. * p < 0.05, ** p < 0.01, **** p < 0.0001.

