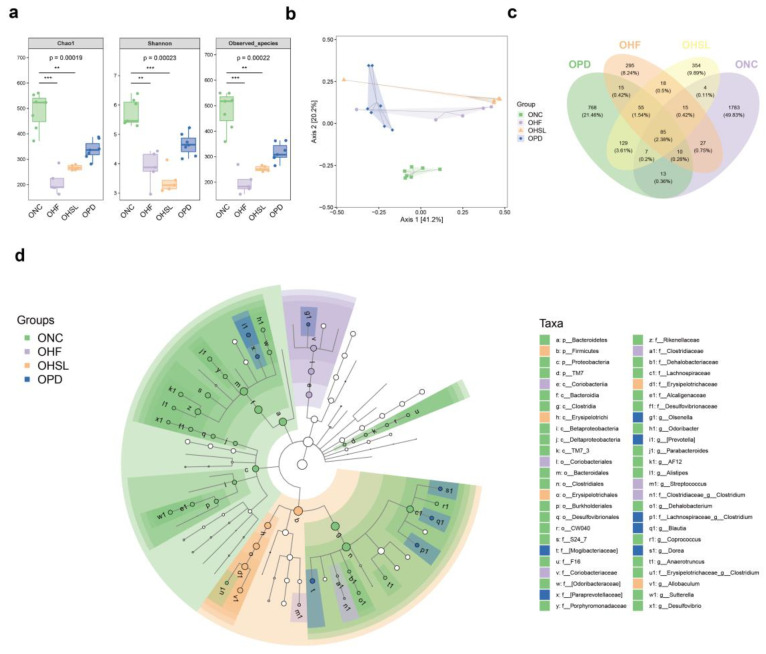
Figure A2.
Alterations of intestinal microbiome in NAFLD mice following FMT. Results from 16S rRNA gene sequencing analysis (V3–V4 region) in the fecal of FMT mice; n = 7 in NC, PD group and n = 5 in HF, HSL group. (a,b) Alpha diversity was assessed by chao 1 index, Shannon diversity index and observed species, respectively (a), and unweighted-UniFrac beta diversity was visualized with the PCoA (b). (c) Venn diagram illustrates the number of common and unique microbiota between different comparison pairs. (d) Cladograms generated by LEfSe depicting taxonomic association between microbiome communities from NC, HF, HSL and PD mice. ** p < 0.01, *** p < 0.001.

