Figure A4.
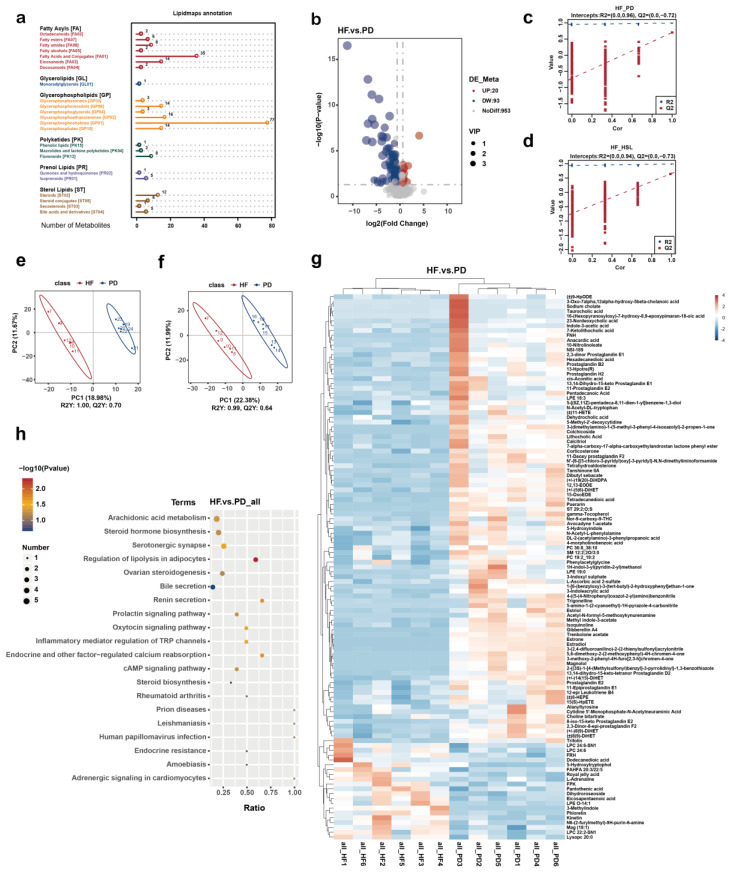
Alterations of metabolites in the serum of NAFLD mice upon polyherbal extract intervention. Analysis results of non-targeted metabolomics in the serum of HF, HSL and PD mice; n = 6. (a) Annotation of metabolite classification results based on LIPID MAPS database. (b) Volcano plot showing the number of upregulated and downregulated metabolites with significant differences in the serum of HF mice compared to PD mice. (c–f) Results of permutation tests conducted with 999 random per mutations in the PLS-DA model (c,d) and the PCA plot (e,f) of HF vs. HSL and HF vs. PD comparisons. (g) Markedly differed metabolites (as indicated by Log2FC) in the serum of HF group compared to PD group. (h) Enriched KEGG pathways in HF group compared with PD group shows the top 20 regulated metabolic pathways; Rich Factor was determined by the ratio of differential metabolites detected to total metabolites of serum samples in that pathway. Significantly different metabolites were screened out by PLS-DA model (VIP > 1 and p < 0.05).

