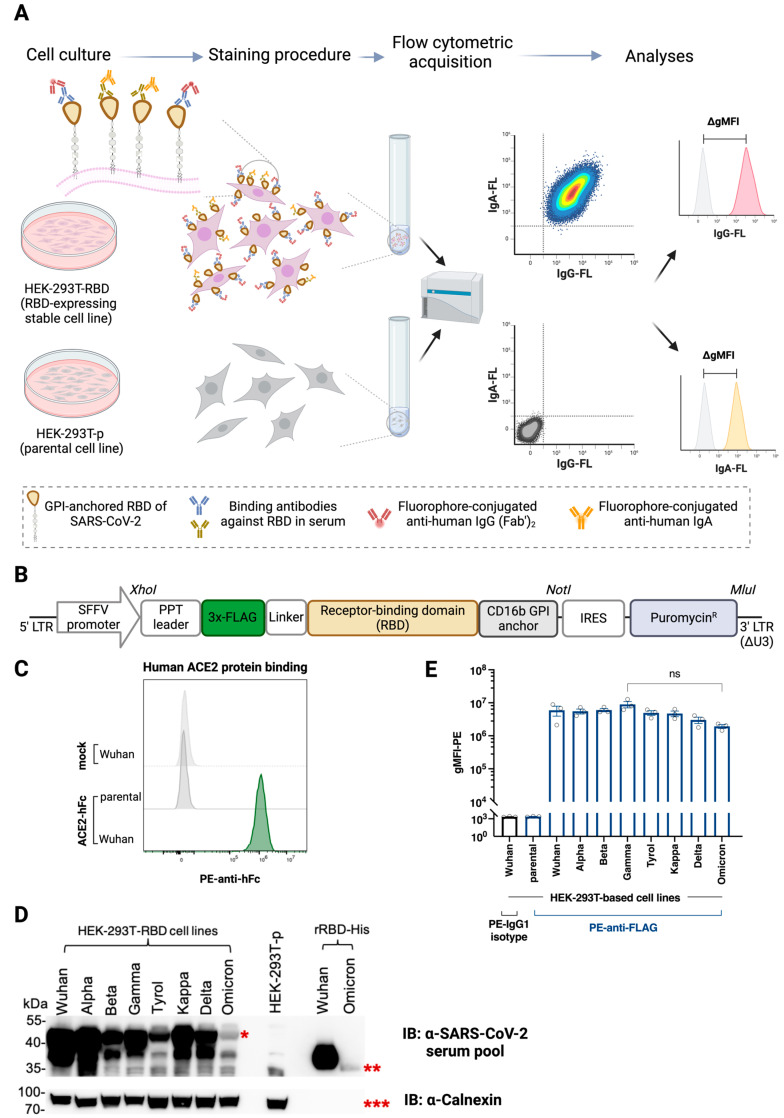
Figure 1.
Principle of the FCCA platform and confirmation of folded RBD expression on cell lines. (A) Shown is the workflow of the FCCA. HEK-293T transfectants or parental HEK-293T(-p) cells are grown in cell culture, harvested, and subjected to incubation with serum samples. During the staining procedure with the respective serum samples, anti-RBD antibodies will bind to the GPI-anchored RBD proteins displayed on the cell surface, followed by their detection with fluorophore-conjugated anti-IgG or -IgA secondary antibodies, respectively. Cells are then acquired on a flow cytometer and the change in the geometric mean fluorescence intensity (∆gMFI) is calculated as the difference between the signal intensity obtained with the RBD-expressing HEK-293T cell line and the HEK-293T-p cells. (B) Representation of the PPT::FLAG::RBD::CD16b-GPI::IRES::Puro expression construct within the pHR-based lentiviral transfer plasmid. (C) Stacked histograms show the flow cytometry-based analysis of human ACE2-hFc protein binding to the Wuhan-Hu-1-RBD-expressing HEK-293T cell line (green) in comparison to the non-transduced HEK-293T-p cells (dark grey). (D) Shown are the representative Western blot analyses (n = 3) of the collection of RBD-expressing HEK-293T cell lysates probed with (upper panel) 1:1000 diluted anti-SARS-CoV-2 human serum pool (n = 5), obtained from vaccinated and/or convalescent individuals with high anti-RBD reactivities. Subsequently, the blot was stripped and probed with rabbit anti-calnexin mAb. The protein ladder in kDa is indicated on the left. *, RBD-GPI proteins within cell lysates (~40 kDa); **, glycosylated recombinant RBD from Wuhan-Hu-1 (~35 kDa) and Omicron (~33 kDa); ***, calnexin (90 kDa). Empty lanes were left on either side of the HEK-293T-p lysate. (E) Bar graphs show the expression (mean ± SEM) of GPI-anchored FLAG-tagged SARS-CoV-2 variants on stably transfected HEK-293T cell lines (n = 3 (circles), each performed in duplicates) determined by flow cytometric analysis. n.s., not significant, as determined by Kruskal–Wallis test followed by Dunn’s multiple comparisons.

