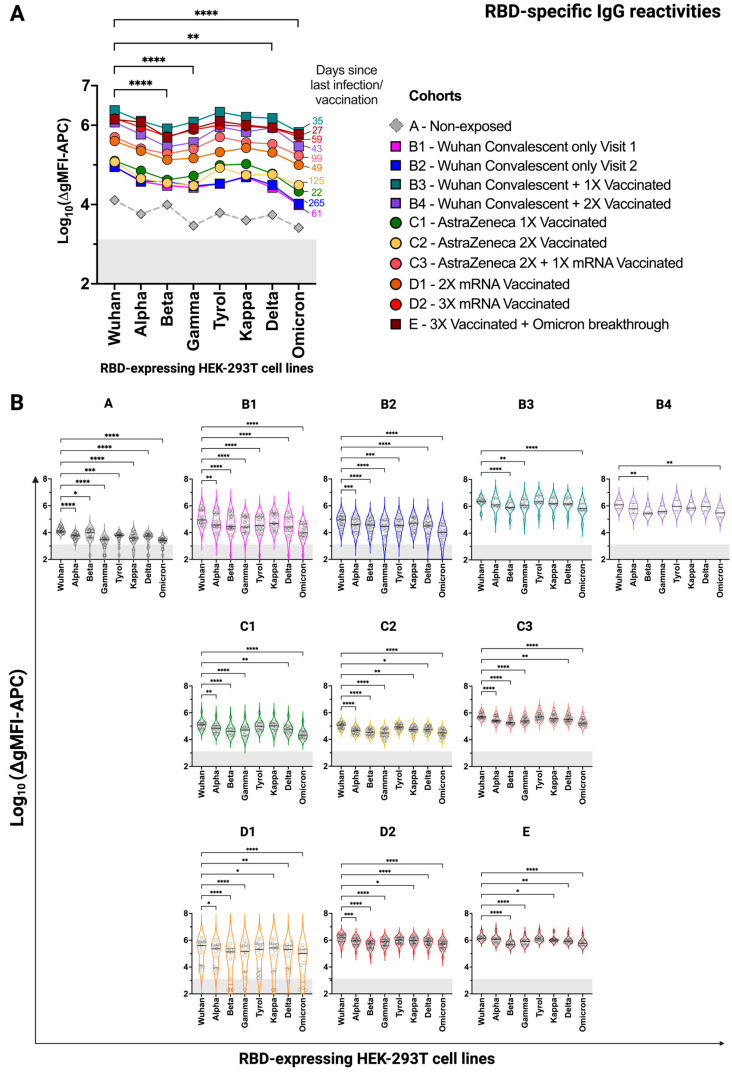
Figure 3.
SARS-CoV-2 RBD-specific IgG reactivity of groups of individuals with the indicated infection/vaccination record determined by the FCCA. (A) The variant-wise comparison of median SARS-CoV-2 anti-RBD IgG antibodies (1:100) across 11 study groups, including results from a non-exposed group. Squares represent convalescent and/or vaccinated groups while circles show exclusively vaccinated groups. The median time, in days, since the last event (infection/vaccination) is displayed on the right side of each graph in the color of the indicated group. (B) The above information represented in group-wise violin plots in the color of the indicated group. Horizontal black lines indicate the median while dotted lines show the upper and lower quartiles. IgG reactivities are displayed as log10(∆gMFI-APC). The area indicating the FCCA threshold is shaded in grey, denoting negative values. *, p < 0.05; **, p < 0.01; ***, p < 0.001; ****, p < 0.0001 as determined by the Friedman test with Dunn’s multiple comparison correction. In (A), the statistical analysis is performed without the non-exposed group.

